

Double Top Neckline, Moving Average, and mBDSR (RCI two-filter) Sell Signal
0
Indicator that shines in combination with RCI【BODSOR・mBDSR】
Methods and Case Studies (PDF) ★GogoJungle AWARD 2020 Winner★
https://www.gogojungle.co.jp/tools/indicators/11836
The PDF file includes 283 items.
Many of them are examples that break down the process of logically linking the higher and lower timeframes using three RCI lines, sequentially considering the status of multiple lower timeframes, and ultimately waiting for a pullback buying or pullback selling timing on the lower timeframe (the mBDSR signal)..
In addition,many focus on capturing points where multiple entry reasons overlap..
The explanations usemore than 1,000 charts.

In recent Investor Navi+ articles,examples that illustrate the high compatibility between various trading methods and mBDSR signalsare introduced focusing on understanding.
AUD/JPY Daily
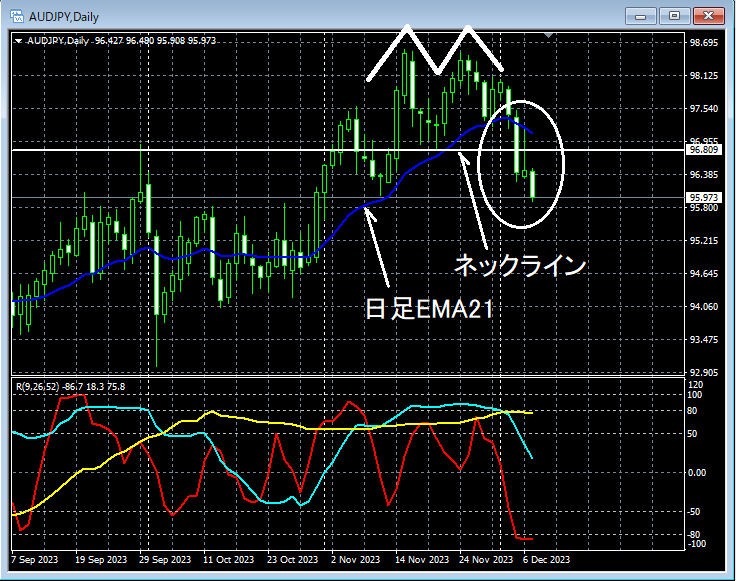
If you look at around the area circled by the white ellipse on the daily chart above,the neck line of the double topappears to have been briefly broken. It might be a scene where it is not strange to consider selling on rallies on the lower timeframe.
AUD/JPY 4-hour
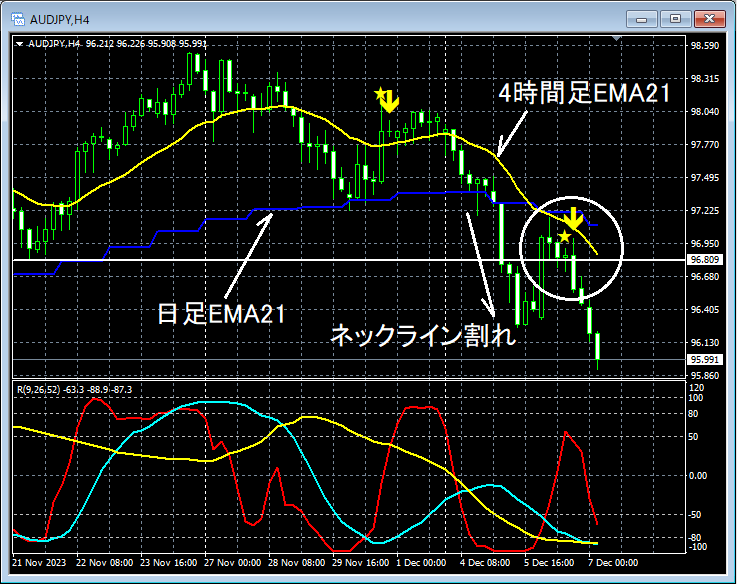
Looking around the area circled by the white circle on the 4-hour chart above,the neck lineis briefly broken, thenthe daily EMA21andthe 4-hour EMA21converge around the point where the price retracesmBDSR (Filter: RCI26 and RCI52) pullback selling signallights up, and subsequently the price declines smoothly.
Indicator that shines in combination with RCI【BODSOR・mBDSR】
Methods and Case Studies (PDF) ★GogoJungle AWARD 2020 Winner★
https://www.gogojungle.co.jp/tools/indicators/11836
The PDF file includes 283 items.
Many of them are examples that break down the process of logically linking the higher and lower timeframes using three RCI lines, sequentially considering the status of multiple lower timeframes, and ultimately waiting for a pullback buying or pullback selling timing on the lower timeframe (the mBDSR signal)..
In addition,many focus on capturing points where multiple entry reasons overlap..
The explanations usemore than 1,000 charts.
× ![]()


