

Recent high, head and shoulders, and mBDSR (RCI2 two-filter) short-selling signal
Indicator that demonstrates power when used in combination with RCI【BODSOR・mBDSR】
Methods and Case Studies (PDF) ★GogoJungle AWARD2020 winner★
https://www.gogojungle.co.jp/tools/indicators/11836
A PDF file with 283 items is attached.
Many of them are examples that have been distilled into a form where multiple lower timeframes are logically linked with higher timeframes using three RCI lines, and finally wait for a timing on the lower timeframe for a Buy on Dip or Sell on Rally (the mBDSR signal)..
Also,many focus on capturing points where multiple entry bases overlap..
In the explanations,more than 1,000 chartsare used.

In the latest Investor Navigation+ article,we introduce examples that show the high compatibility between various trading methods and the mBDSR signals..
GBPCHF Daily
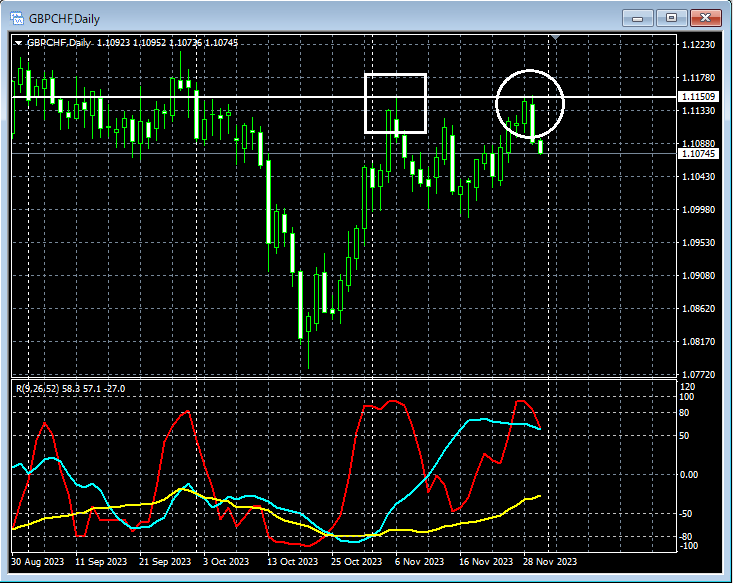
Looking at the area circled in white on the above daily chart,the price has risen close to the recent high. It wouldn’t be strange to expect a slight pullback for a brief moment.
GBPCHF 30-minute
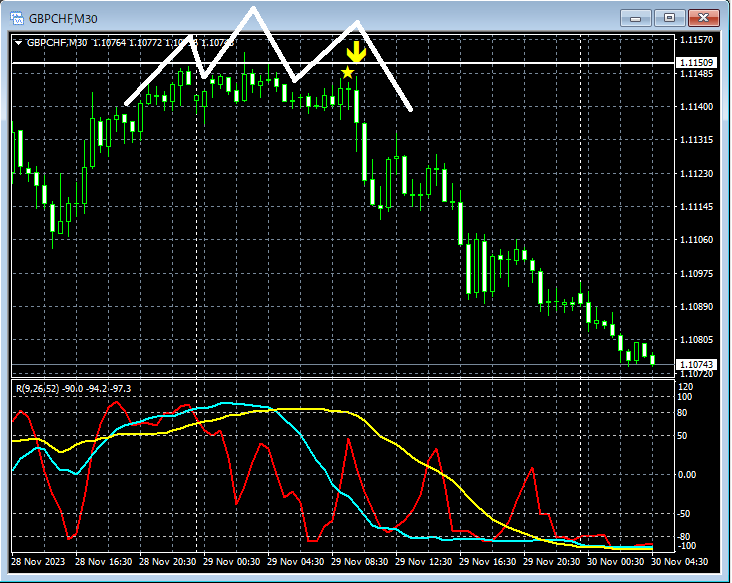
On the 30-minute chart above,the price rose toward the recent high, at which pointmBDSR (Filter: RCI26 and RCI52) Sell on Rally signallighted up, and thereafter the price has been declining steadily.
Furthermore,a right shoulder of a Head and Shoulders patternhas triggered the Sell on Rally signal at the right shoulder.
Indicator that demonstrates power when used in combination with RCI【BODSOR・mBDSR】
Methods and Case Studies (PDF) ★GogoJungle AWARD2020 winner★
https://www.gogojungle.co.jp/tools/indicators/11836
A PDF file with 283 items is attached.
Many of them are examples that have been distilled into a form where multiple lower timeframes are logically linked with higher timeframes using three RCI lines, and finally wait for a timing on the lower timeframe for a Buy on Dip or Sell on Rally (the mBDSR signal)..
Also,many focus on capturing points where multiple entry bases overlap..
In the explanations,more than 1,000 chartsare used.
× ![]()


