

Resistance-turned-support, double bottom, and mBDSR (RCI2 two-fil ter) pullback buying signal
0
Indicator that shines when combined with RCI【BODSOR・mBDSR】
Methods and Case Studies (PDF) ★GogoJungle AWARD2020 winner★
https://www.gogojungle.co.jp/tools/indicators/11836
283 PDF files are included.
Many of them are examples that lay out a form where, by linking higher and lower timeframes logically using the RCI 3-line setup, the situations of multiple lower timeframes are sequentially analyzed, and ultimately the timing to buy on dips or sell on rallies on the lower timeframe (i.e., the mBDSR signal) is awaited..
Also,there are many that focus on capturing points where multiple entry reasons overlap..
The explanations usemore than 1,000 charts..

In recent 投資ナビ+ articles,we present examples that illustrate the high compatibility between various trading methods and mBDSR signals..
AUDNZD 4-hour chart
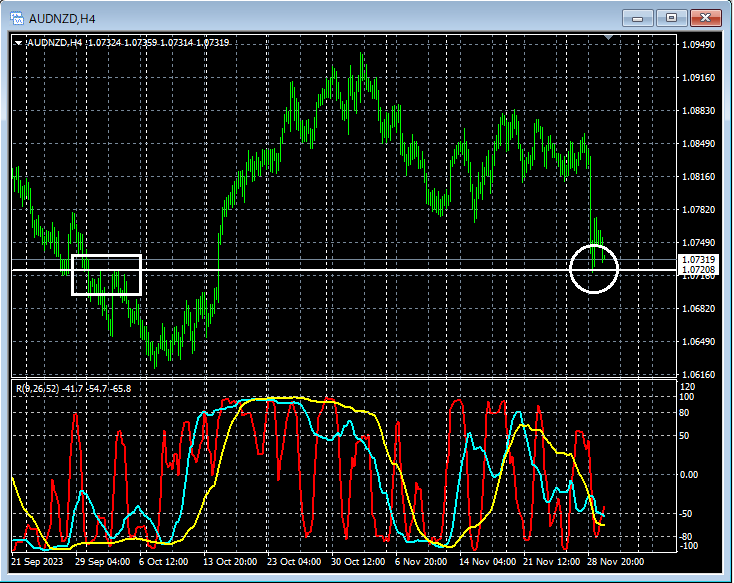
If you look at around the area circled in white on the 4-hour chart above,you can see that the price has fallen to near a line that previously acted as resistancenearby.Possible reversal from resistance to supportand it might be reasonable to expect a rise from there.
AUDNZD 5-minute chart
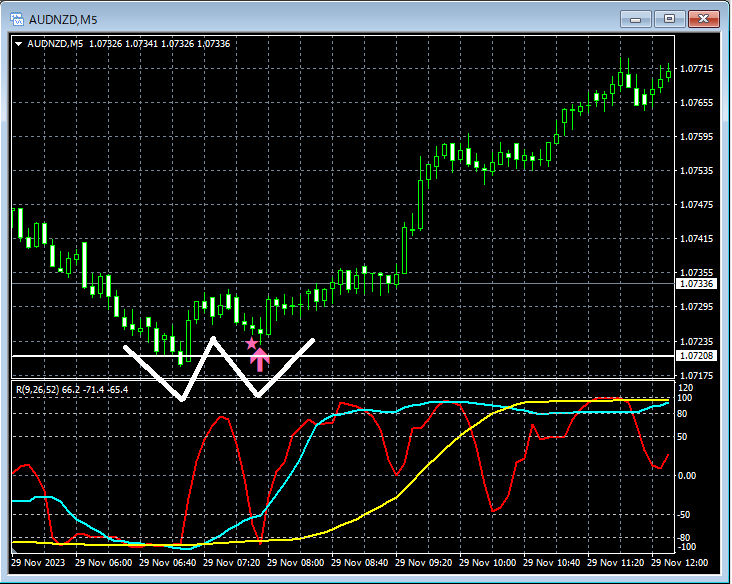
On the 5-minute chart above,the line that previously functioned as resistancehas been reached again, andthe mBDSR (filters: RCI26 and RCI52) buy-the-dip signalhas lit up, and subsequently the price has risen smoothly.
From this example,there is a strong synergy between trendline-based resistance-to-support reversal trading methodsandmBDSR signals.
Moreover, as a result,a double bottomproduces a dip-buy signal on the right-hand valley.
Additionally, in this example,placing a stop loss slightly below the recent lowallows for ahigh risk-reward trade.
Indicator that shines when combined with RCI【BODSOR・mBDSR】
Methods and Case Studies (PDF) ★GogoJungle AWARD2020 winner★
https://www.gogojungle.co.jp/tools/indicators/11836
283 PDF files are included.
Many of them are examples that lay out a form where, by linking higher and lower timeframes logically using the RCI 3-line setup, the situations of multiple lower timeframes are sequentially analyzed, and ultimately the timing to buy on dips or sell on rallies on the lower timeframe (i.e., the mBDSR signal) is awaited..
Also,there are many that focus on capturing points where multiple entry reasons overlap..
The explanations usemore than 1,000 charts..
× ![]()


