

Support Resistance Turnover and Moving Averages and mBDSR (RCI with 2 filters) Short/Sell Signal
0
Indicator that shines when combined with RCI【BODSOR・mBDSR】
methods and case studies (PDF) ★GogoJungle AWARD2020 WINNER★
https://www.gogojungle.co.jp/tools/indicators/11836
The PDF file includes 283 items.
Many of them are examples that break down the process into linking higher and lower timeframes logically using three RCI lines, examining the situations of multiple lower timeframes sequentially, and ultimately waiting for pullback buying or retracement selling timing on the lower timeframe (the mBDSR signal)..
Also,many focus on identifying points where multiple entry reasons converge.
In the explanationsmore than 1,000 chartsare used.

In recent Investment Navigator+ articles,we introduce examples that illustrate the high compatibility between various trading methods and mBDSR signals.
USD/JPY (Canadian Dollar Yen) 1-hour chart
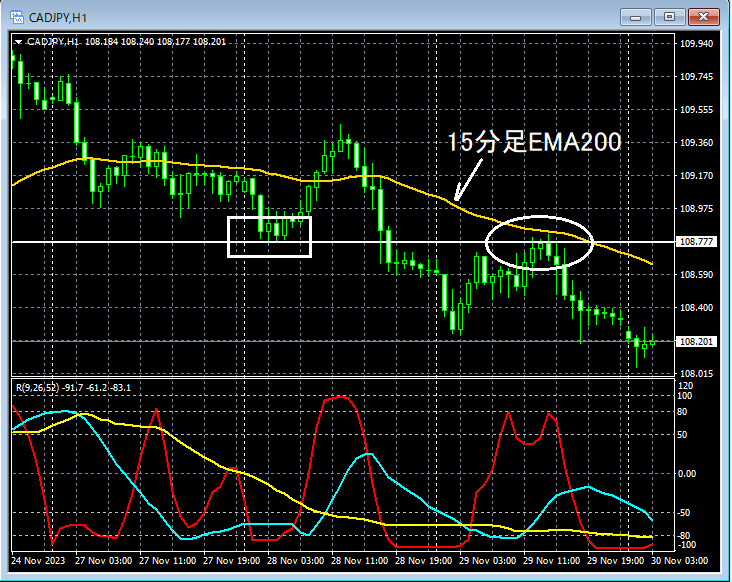
If you look around the area circled in white on the 1-hour chart above,the line that used to act as supportandthe 15-minute EMA200overlap there, indicating an upmove.From support/resistance reversalit wouldn’t be surprising to consider a potential drop.
USD/JPY 5-minute chart
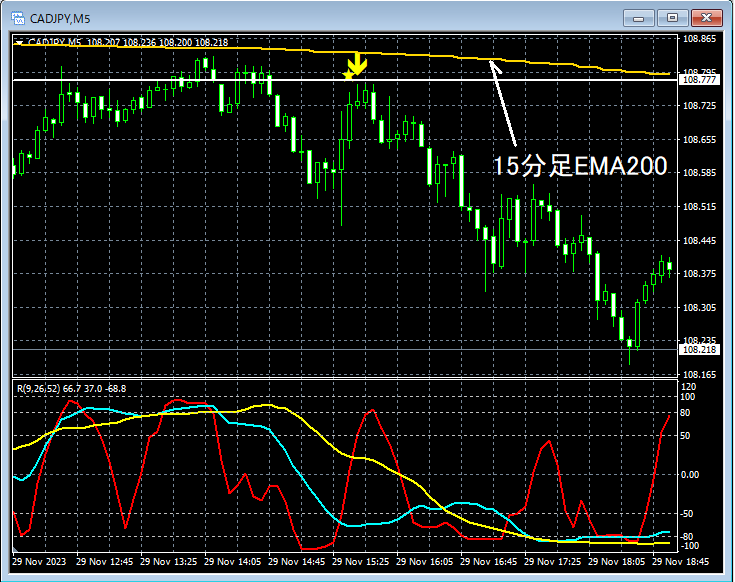
On the 5-minute chart above,the line that used to function as supportandthe 15-minute EMA200overlap there,mBDSR (filters: RCI26 and RCI52) sell signal on pullbacklights up, and thereafter the price declines steadily.
From this example,the high compatibility between trading methods that focus on support/resistance and moving averagesandmBDSR signalsis evident.
Also, in this example,placing a stop-loss slightly above the recent highandachieving a high risk-reward tradeis possible.
Indicator that shines when combined with RCI【BODSOR・mBDSR】
methods and case studies (PDF) ★GogoJungle AWARD2020 WINNER★
https://www.gogojungle.co.jp/tools/indicators/11836
The PDF file includes 283 items.
Many of them are examples that break down the process into linking higher and lower timeframes logically using three RCI lines, examining the situations of multiple lower timeframes sequentially, and ultimately waiting for pullback buying or retracement selling timing on the lower timeframe (the mBDSR signal)..
Also,many focus on identifying points where multiple entry reasons converge.
In the explanationsmore than 1,000 chartsare used.

× ![]()


