

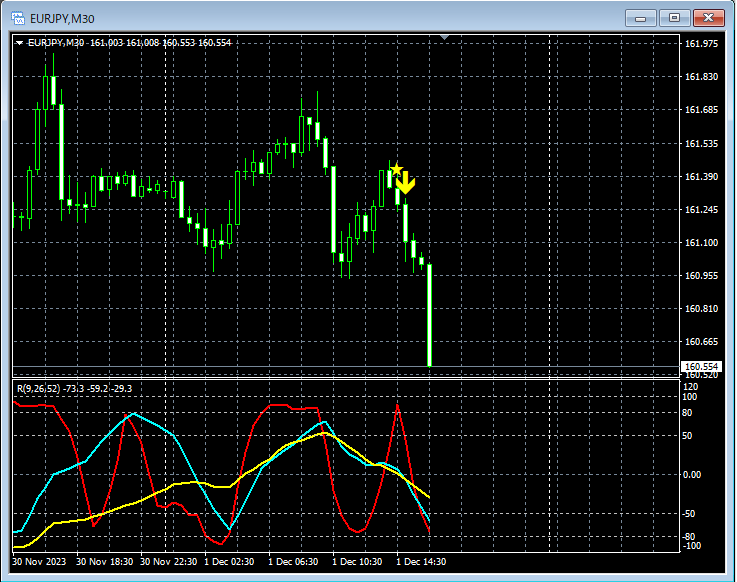
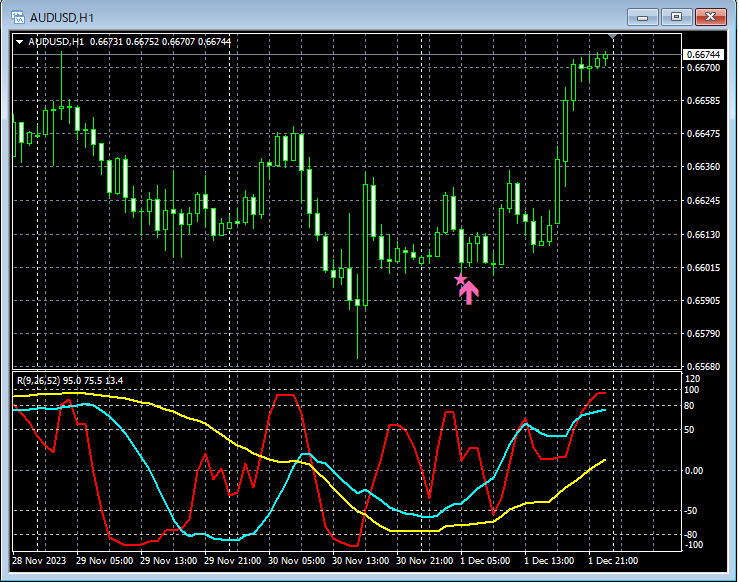
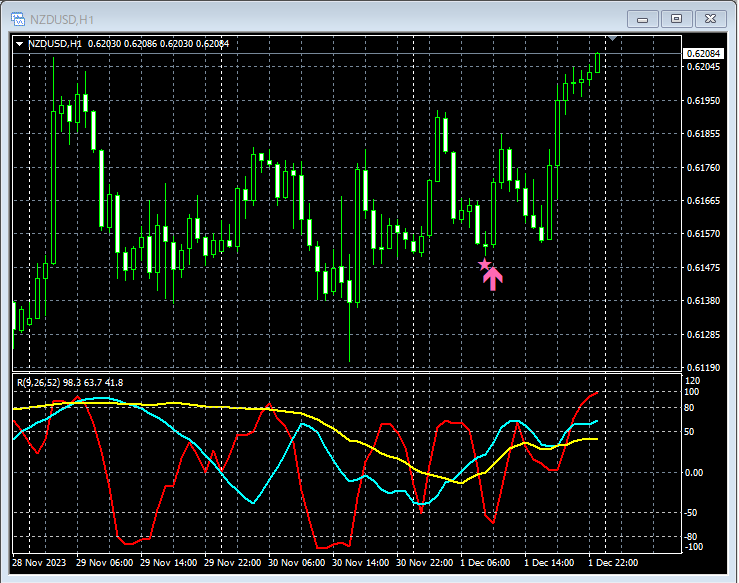
■ [RCI3 Three-Line + mBDSR Sign] Example (November 27 – December 1)
An indicator that shines when combined with RCI【BODSOR・mBDSR】
and methodology / case studies (PDF) ★GogoJungle AWARD2020 winner★
https://www.gogojungle.co.jp/tools/indicators/11836
The PDF file accompanies 283 items.
Many of them are examples that have been distilled into a form in which, by using three RCI lines to logically link higher and lower timeframes, the situations of multiple lower timeframes are examined sequentially, and finally the timing for a pullback buying or a pullback selling on the lower timeframe (the mBDSR signal) is awaited.
Also,many focus on capturing points where multiple entry reasons overlap.
The explanations useover 1,000 charts.

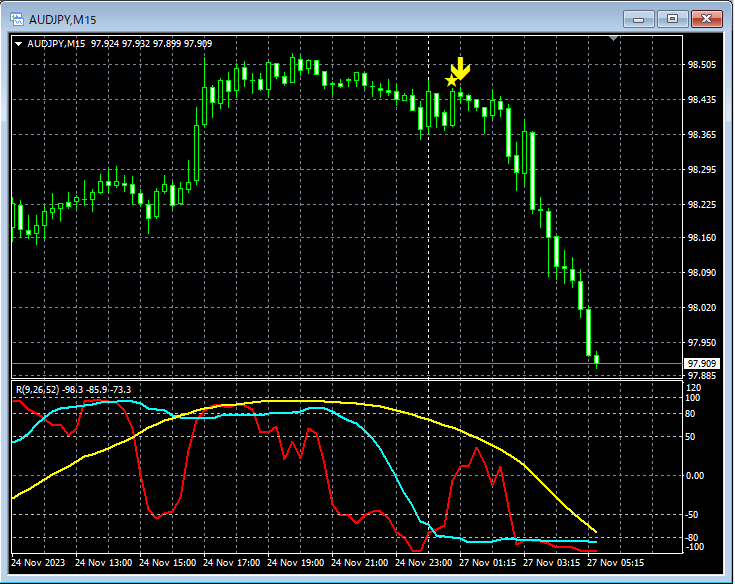
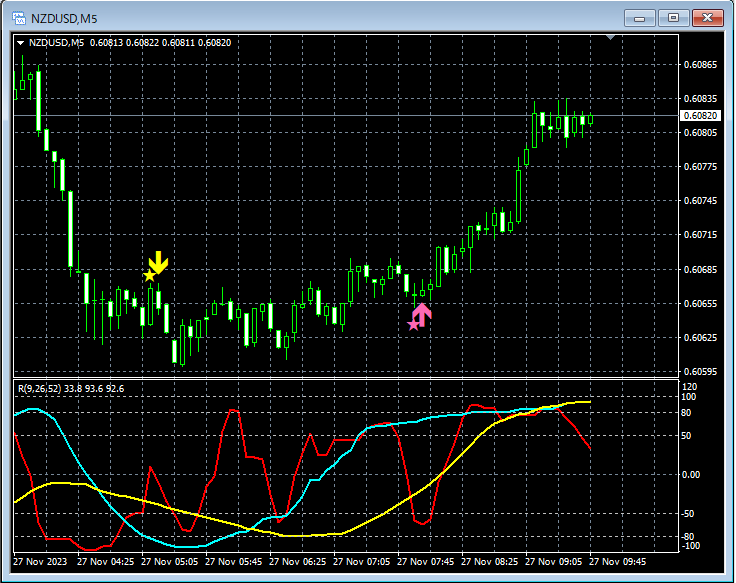
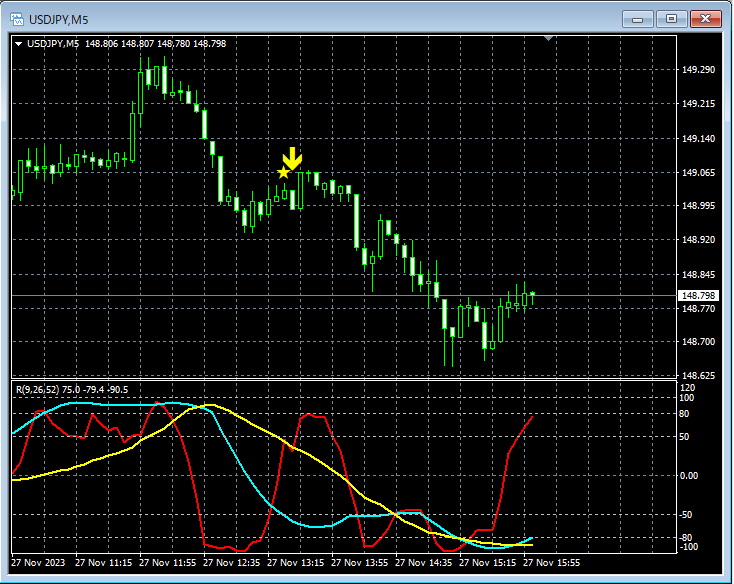
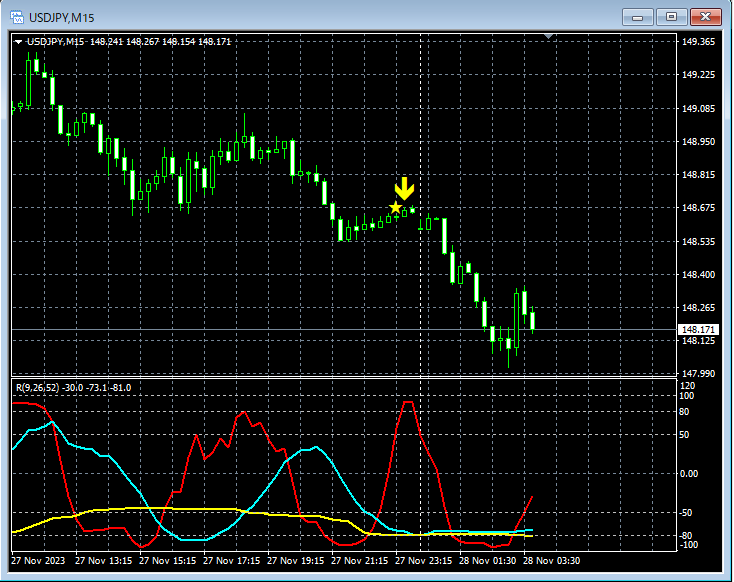
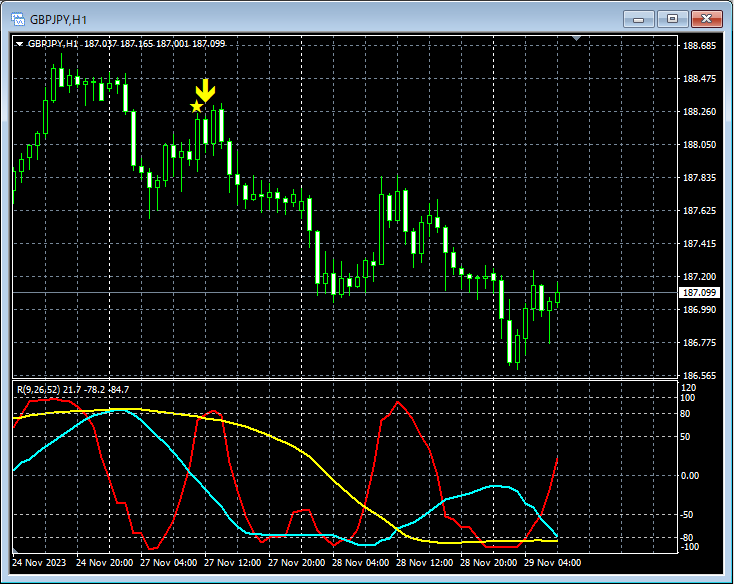
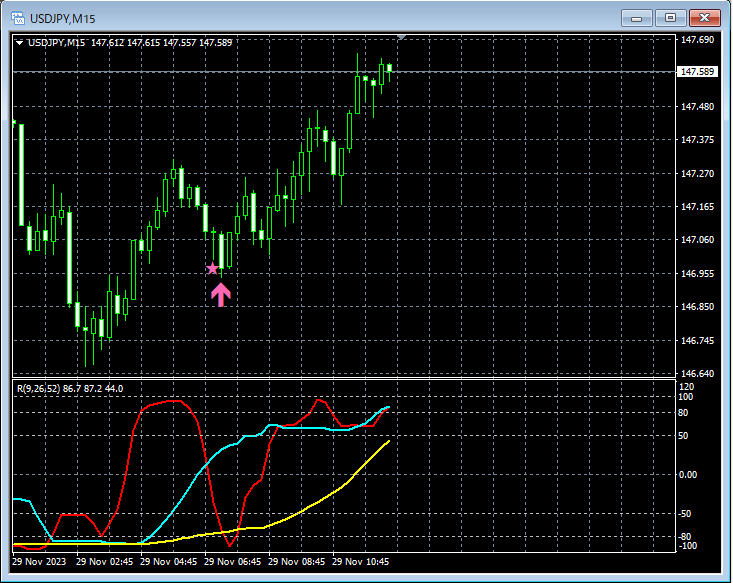
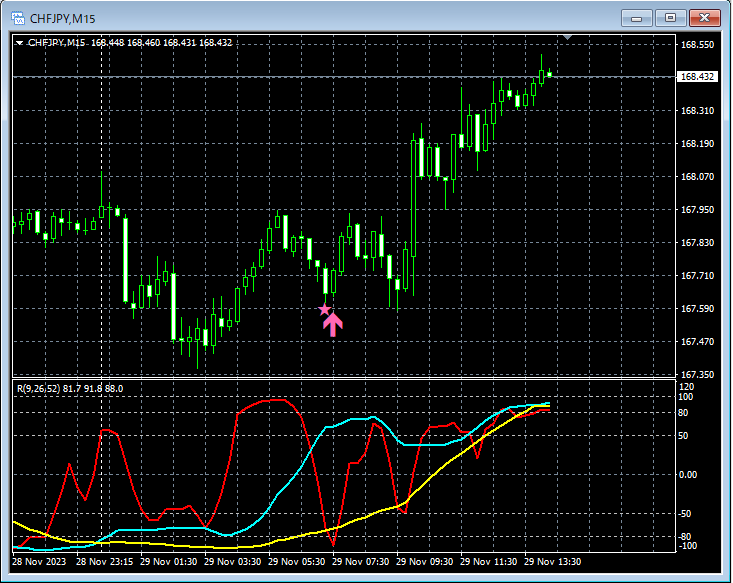
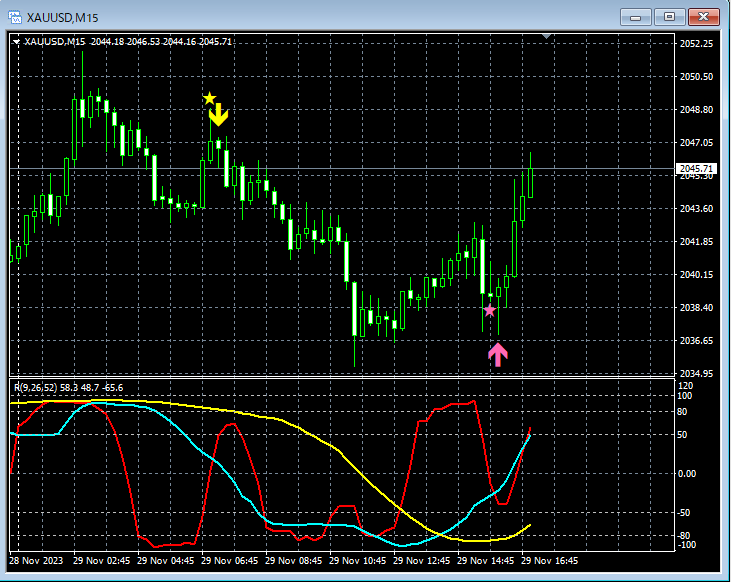
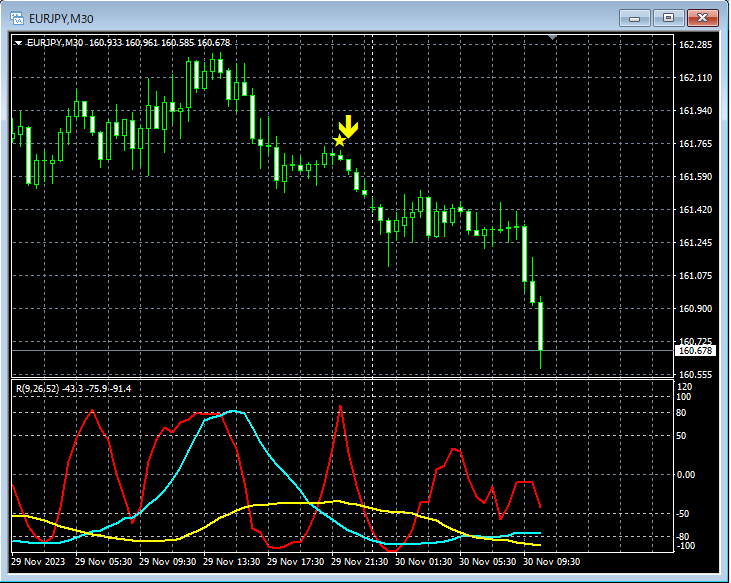
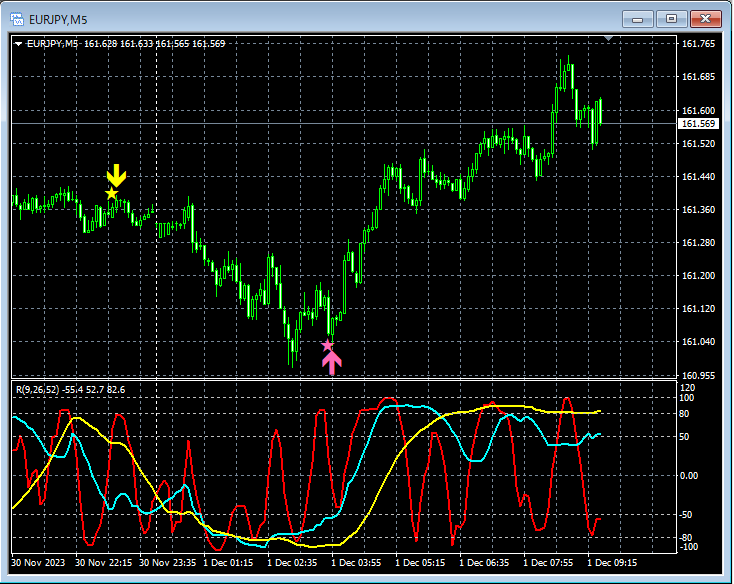
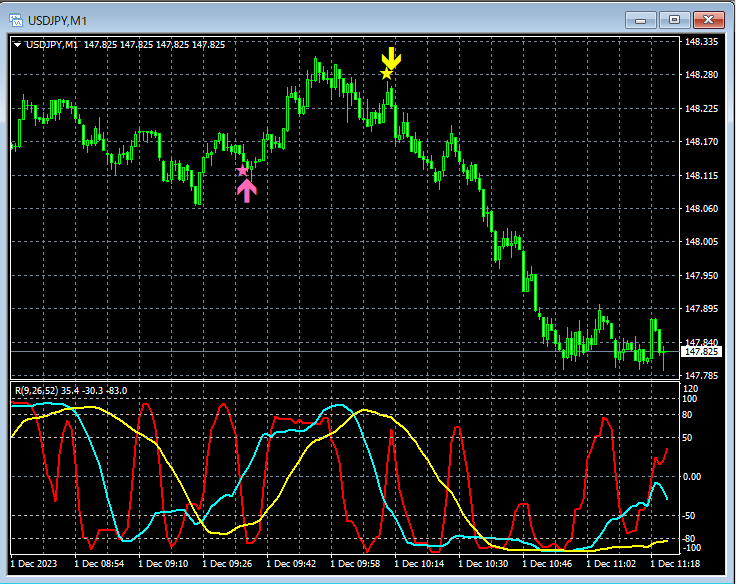
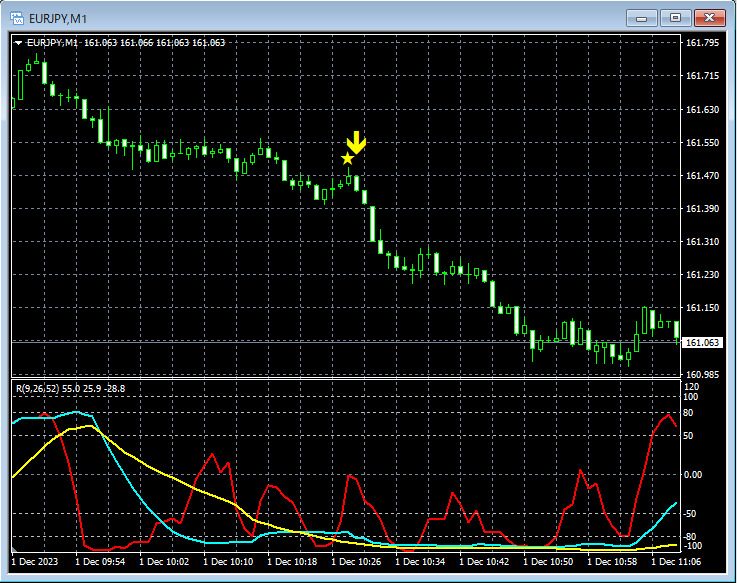
Below, from November 27 to December 1, we pick up and introduce examples where the signals of mBDSR (RCI two-line filter version) seemed to function well.
An indicator that shines when combined with RCI【BODSOR・mBDSR】
and methodology / case studies (PDF) ★GogoJungle AWARD2020 winner★
https://www.gogojungle.co.jp/tools/indicators/11836
The PDF file accompanies 283 items.
Many of them are examples that have been distilled into a form in which, by using three RCI lines to logically link higher and lower timeframes, the situations of multiple lower timeframes are examined sequentially, and finally the timing for a pullback buying or a pullback selling on the lower timeframe (the mBDSR signal) is awaited.Also,
many focus on capturing points where multiple entry reasons overlap.
The explanations useover 1,000 charts.

× ![]()


