

Double bottom neck line and mBDSR (RCI 2-band filter) pullback buy signal
0
Indicator with powerful performance when combined with RCI【BODSOR・mBDSR】
Method and Case Studies (PDF) ★GogoJungle AWARD2020 winner★
https://www.gogojungle.co.jp/tools/indicators/11836
The PDF file includes 283 items.
Many of them are examples that lay out a form in which multiple lower-timeframe conditions are sequentially considered by logically linking the higher and lower timeframes using three RCI lines, ultimately waiting for pullback buying or pullback selling signals on the lower timeframe (i.e., mBDSR signals)..
Also,many focus on catching points where multiple entry reasons overlap..
In the explanations,more than 1,000 chartsare used.

In recent investors’ guidance articles,we mainly introduce examples that show the high compatibility between various trading methods and mBDSR signals.
USDCAD Daily
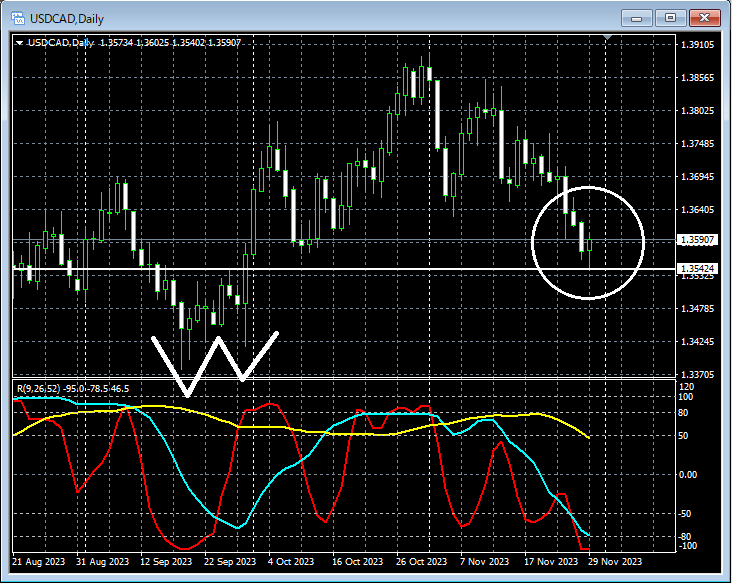
If you look at the area circled in white on the higher timeframe,the neck line of the double bottomis near, and it might not be surprising to consider a slight rise for a moment.
USDCAD 5-minute
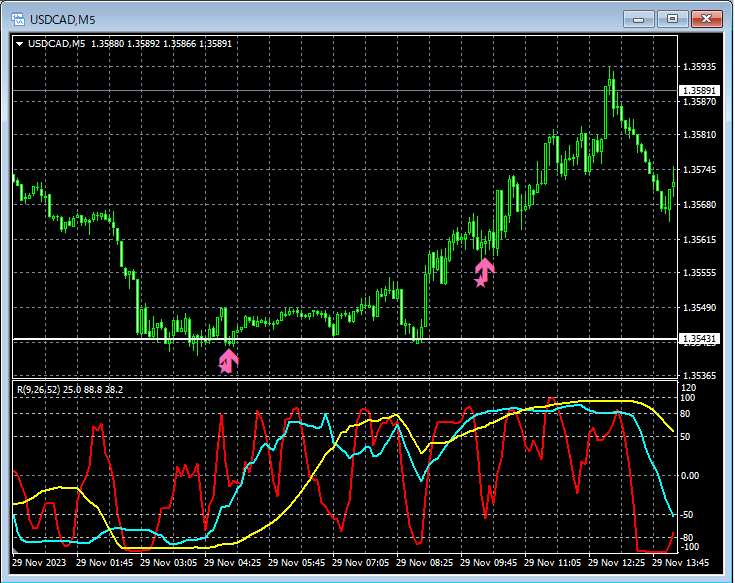
On the 5-minute chart above, from near theneck line of the double bottomon the daily chart, there is a rebound, and in the process,mBDSR (filter: RCI26 and RCI52)pullback buying signals illuminate twice, and the price is rising smoothly.
From this example,the trade method focused on the neck line of the double bottomandthe mBDSR signalsshow a high degree of compatibility.
Indicator with powerful performance when combined with RCI【BODSOR・mBDSR】
Method and Case Studies (PDF) ★GogoJungle AWARD2020 winner★
https://www.gogojungle.co.jp/tools/indicators/11836
The PDF file includes 283 items.
Many of them are examples that lay out a form in which multiple lower-timeframe conditions are sequentially considered by logically linking the higher and lower timeframes using three RCI lines, ultimately waiting for pullback buying or pullback selling signals on the lower timeframe (i.e., mBDSR signals)..
Also,many focus on catching points where multiple entry reasons overlap..
In the explanations,more than 1,000 chartsare used.
× ![]()


