

Dollar-Yen: A short signal (selling) at pullback using moving averages, Fibonacci retracement, neckline, and mBDSR (RCI double-filter)
Indicator that shines when combined with RCI【BODSOR・mBDSR】
Methods & Case Studies (PDF) ★GogoJungle AWARD2020 Winner★
https://www.gogojungle.co.jp/tools/indicators/11836
There are 283 PDF files included.
Many of them are composed as examples that, using three RCI lines to logically link higher and lower timeframes, sequentially examine the conditions of multiple lower timeframes and ultimately wait for the timing to buy on dips or sell on rallies in the lower timeframe (i.e., the mBDSR signal).This is what they have become.
Also,many focus on capturing points where multiple entry confirmations converge.
The explanations utilizeover 1,000 charts in total.

In recent Investor Navigator+ articles,we highlight the strong compatibility of various trading methods with mBDSR signalsthrough examples that illustrate this.
Dollar/Yen 1-hour chart
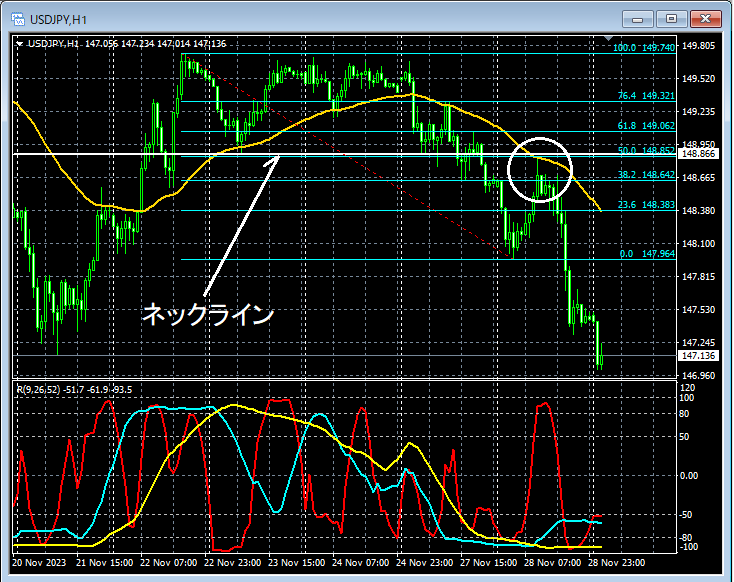
Looking at around the area circled in white on the 1-hour chart above,Fibonacci retracement 50%and the moving average that has historically acted as support or resistanceMoving Average(15-minute EMA200) andNecklineoverlap, indicating a pullback to that area. It may not be surprising to consider a potential downside move for a while.
Dollar/Yen 5-minute chart
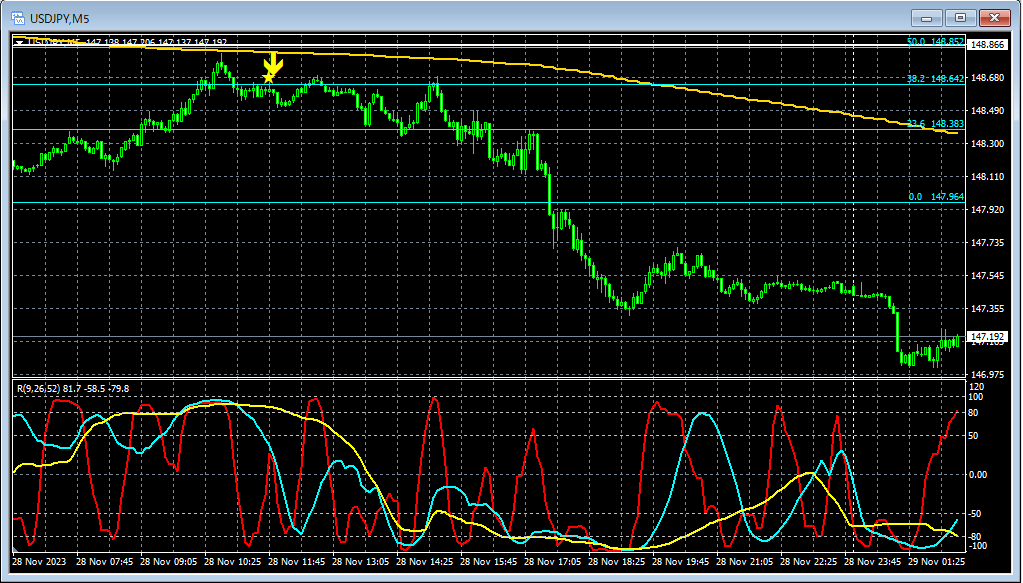
On the 5-minute chart above,15-minute EMA200is slightly lowered from near the area,mBDSR (RCI two-filter) pullback sell signallights up, and afterward, price fails to make a new swing high and declines.
From this example,a trading method focusing on Fibonacci retracements, moving averages, and necklinesandthe signal of mBDSRshow a high degree of harmony.
Indicator that shines when combined with RCI【BODSOR・mBDSR】
Methods & Case Studies (PDF) ★GogoJungle AWARD2020 Winner★
https://www.gogojungle.co.jp/tools/indicators/11836
There are 283 PDF files included.
Many of them are composed as examples that, using three RCI lines to logically link higher and lower timeframes, sequentially examine the conditions of multiple lower timeframes and ultimately wait for the timing to buy on dips or sell on rallies in the lower timeframe (i.e., the mBDSR signal).This is what they have become.
Also,many focus on capturing points where multiple entry confirmations converge.
The explanations utilizeover 1,000 charts in total..

× ![]()


