

Support line and three RCI lines and EMA21 and mBDSR bearish reversal signal
0
Indicator that shines in combination with RCI: BODSOR and mBDSR
Methods and Case Studies (PDF) ★GogoJungle AWARD2020 Winner★
https://www.gogojungle.co.jp/tools/indicators/11836
The PDF file contains 283 items.
Many of them are examples that have been developed to logically link higher and lower timeframes using three RCI lines, sequentially considering the status of multiple lower timeframes, and ultimately waiting for a pullback buying or pullback selling signal on the lower timeframe (the mBDSR signal)..
Also,many focus on capturing points where multiple entry reasons overlap.There are many such items.
The explanations usemore than 1,000 charts.

In recent Investor Navi+ articles,we mainly present examples that show the high compatibility between various trading methods and the mBDSR signals..
EURAUD 1-hour chart
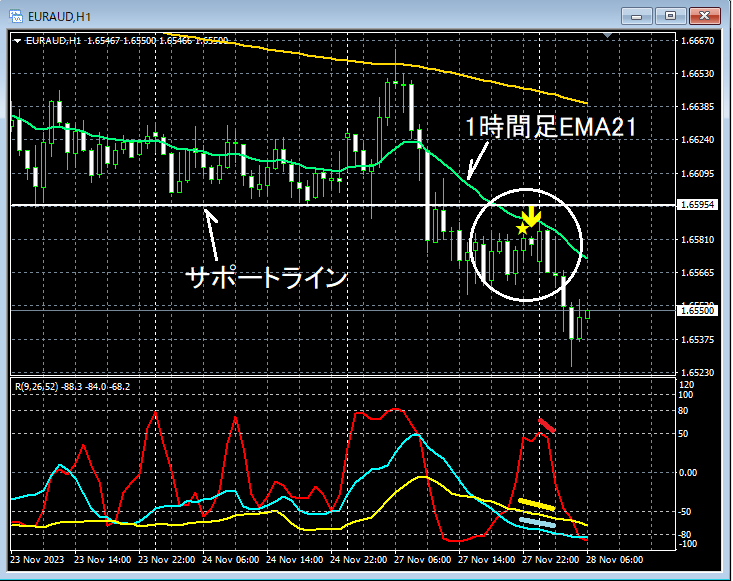
If you look around the area encircled in white on the upper 1-hour chart, for a whilea line that functioned as supportwas broken to the downside, and on the reboundmBDSR (filters: RCI26 and RCI52) pullback selling signallights up, and thereafter,the three RCI linesline up, forming a very weak down move. It may not be strange to anticipate further downside.
EURAUD 5-minute chart
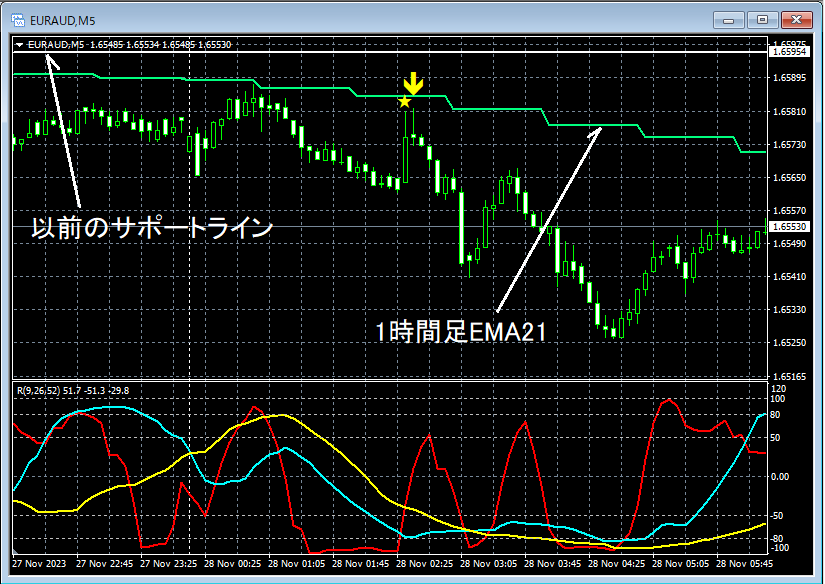
On the 1-hour chart,the three RCI linesare aligned in a weak-down configuration, while on the upper 5-minute chart,near the 1-hour EMA21retreatmBDSR (filters: RCI26 and RCI52) pullback selling signallights up, and price then declines smoothly.
From this example,the combination of a support-level line or moving average-following techniqueanda trading method using the three RCI linesandthe mBDSR signalshow a high degree of compatibility.
Indicator that shines in combination with RCI: BODSOR and mBDSR
Methods and Case Studies (PDF) ★GogoJungle AWARD2020 Winner★
https://www.gogojungle.co.jp/tools/indicators/11836
The PDF file contains 283 items.
Many of them are examples that have been developed to logically link higher and lower timeframes using three RCI lines, sequentially considering the status of multiple lower timeframes, and ultimately waiting for a pullback buying or pullback selling signal on the lower timeframe (the mBDSR signal)..
Also,many focus on capturing points where multiple entry reasons overlap.There are many such items.
The explanations usemore than 1,000 charts.

× ![]()


