

EMA200 and pin bar and mBDSR (RCI2 filter of 2 lines) Sell signal
0
Indicator that shines in combination with RCI【BODSOR・mBDSR】
Methods and Case Studies (PDF) ★GogoJungle AWARD2020 Winner★
https://www.gogojungle.co.jp/tools/indicators/11836
283 PDF files are included.
Many of them are examples that break down the process of logically linking higher and lower timeframes using 3 RCI lines, examining the conditions of multiple lower timeframes sequentially, and finally waiting for buying opportunities on pullbacks or selling opportunities on rallies in the lower timeframe (the mBDSR signal)..
Also,many focus on identifying points where multiple entry rationale overlap..
In the explanations,more than 1,000 chartsare used.

In recent Investor Navi+ articles,we show examples that highlight the high compatibility of various trading methods with the mBDSR signals..
EURAUD 1-hour chart
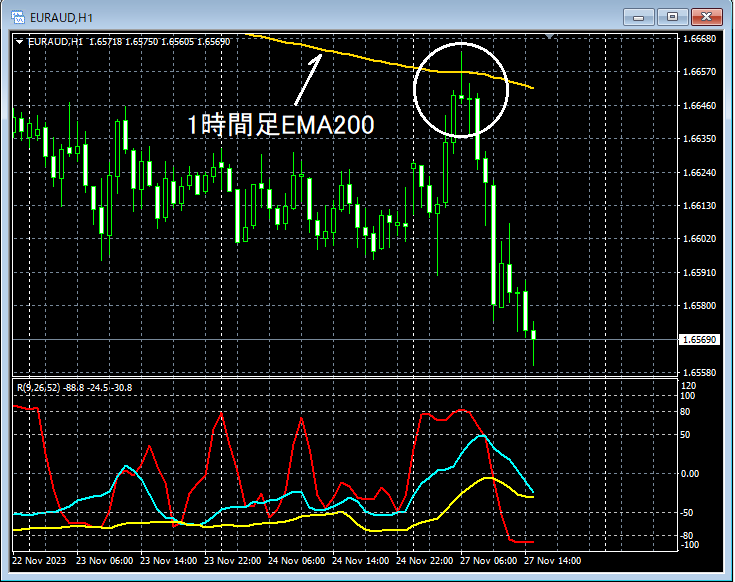
The higher timeframe chart is omitted, but on the 4-hour chartthe 1-hour EMA200has not clearly broken above, continuing a bearish trend.
Looking at the area circled with a white circle on the 1-hour chart above,the 1-hour EMA200has been pulled back to near it, suggesting further downsidelong upper shadows (hammer-like candles)may appear. It may not be surprising if prices go lower.
EURAUD 5-minute chart
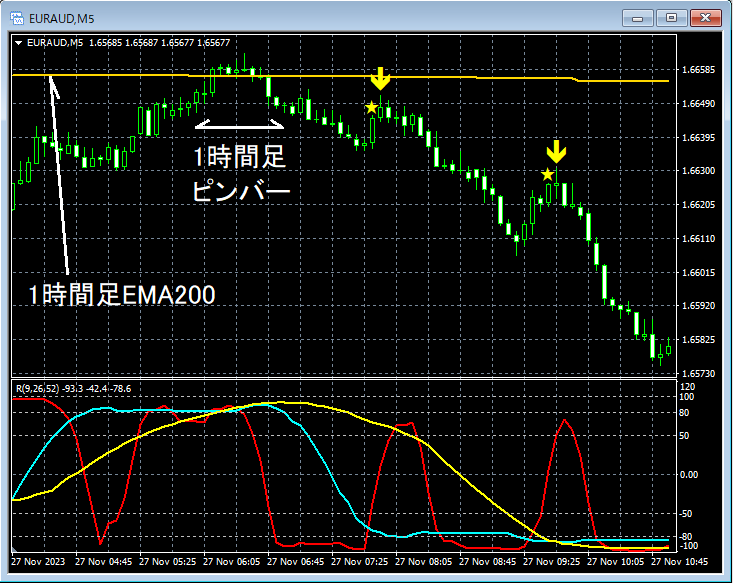
On the higher 5-minute chart, after apin barformed on the 1-hour chart,mBDSR (filter: RCI26 and RCI52) lit up, and subsequently price declined smoothly.
From this example,the high compatibility between moving average/pin bar trading methodsandmBDSR signalsis evident.
Indicator that shines in combination with RCI【BODSOR・mBDSR】
Methods and Case Studies (PDF) ★GogoJungle AWARD2020 Winner★
https://www.gogojungle.co.jp/tools/indicators/11836
283 PDF files are included.
Many of them are examples that break down the process of logically linking higher and lower timeframes using 3 RCI lines, examining the conditions of multiple lower timeframes sequentially, and finally waiting for buying opportunities on pullbacks or selling opportunities on rallies in the lower timeframe (the mBDSR signal)..
Also,many focus on identifying points where multiple entry rationale overlap..
In the explanations,more than 1,000 chartsare used.

× ![]()


