

AUDJPY: Counter-trend line, support pullback, and mBDSR (RCI with 2-line filter) short signals
0
The combination with RCI makes its strength known: Indicator BODSOR・mBDSR
and methods and case studies (PDF) ★GogoJungle AWARD2020 Recipient★
https://www.gogojungle.co.jp/tools/indicators/11836
A PDF file bundle of 283 items is included.
Many of them aresummaries of examples that break down the process from logically linking higher and lower timeframes with three RCI lines, considering the situations of multiple lower timeframes sequentially, and finally waiting for a pullback buy or a retracement sell timing (the mBDSR signal) on the lower timeframe.
Also,many focus on capturing points where multiple entry grounds overlap.
In the explanations,more than 1,000 chartsare used.

In recent articles on Investment Navigator+,examples that show the high compatibility between various trading methods and the mBDSR signalsare highlighted.
AUD/JPY 1-hour
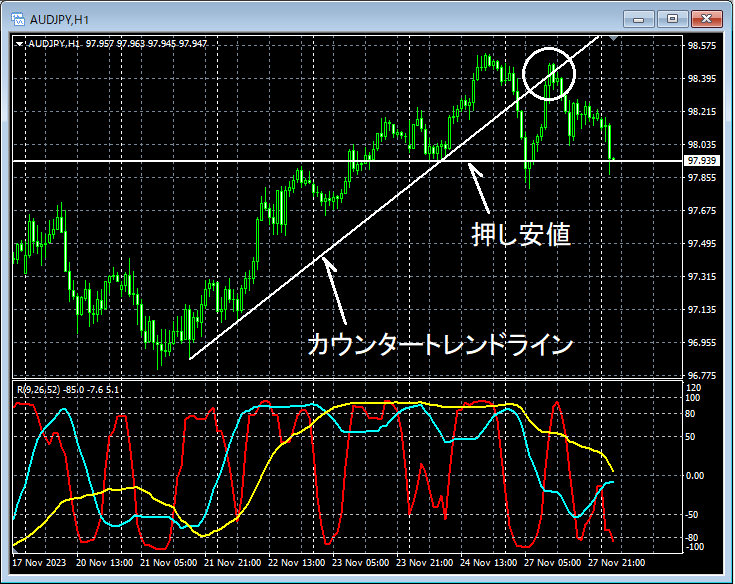
Looking at the area circled in white on the 1-hour chart above,counter-trend lineandswing lowsare retraced to near thecounter-trend lineafter breaking below. Considering that it has broken below thecounter-trend lineandswing lowsyou might expect a rising opportunity to sell on a retrace.
AUD/JPY 5-minute
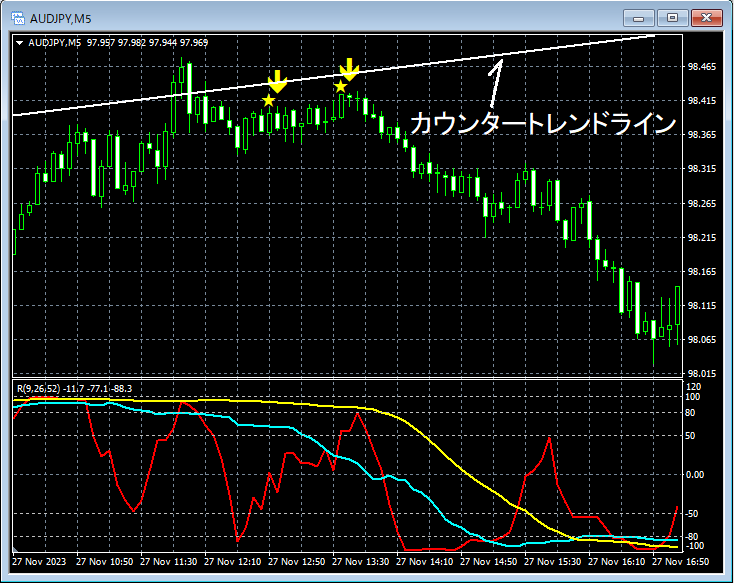
On the 5-minute chart above,counter-trend linearound whichmBDSR (filter: RCI26 and RCI52)lights up, and subsequently the price declines smoothly.
From this example,a trading method focused on swing lows and counter-trend linesandmBDSR signalsshow a strong compatibility.
The indicator that shines with RCI combination: BODSOR・mBDSR
and method and case studies (PDF) ★GogoJungle AWARD2020 Recipient★
https://www.gogojungle.co.jp/tools/indicators/11836
A PDF file bundle of 283 items is included.
Many of them areexamples that break down the process from logically linking higher and lower timeframes with three RCI lines, considering the situations of multiple lower timeframes sequentially, and finally waiting for a pullback buy or a retracement sell timing (the mBDSR signal).
Also,many focus on capturing points where multiple entry grounds overlap.
In the explanations,more than 1,000 chartsare used.

× ![]()


