

USDJPY: Signals of support/resistance reversal from moving averages and return move, and R1 R2 S2 signs
0
Indicator that delivers power in combination with RCI【BODSOR・mBDSR】
Methods and Case Studies (PDF) ★GogoJungle AWARD2020 Winner★
https://www.gogojungle.co.jp/tools/indicators/11836
283 PDF files are included.
Many of them are compiled as examples that explain sequentially the status of multiple lower timeframes by logically linking the higher and lower timeframes using three RCI lines, and ultimately waiting for the timing of buying on dips or selling on retracements on the lower timeframes (=mBDSR signals)..
Also,many focus on capturing points where multiple entry reasons coincide.
The explanations usemore than 1,000 chartsin total.

※【R1R2S2】is included in the above product.
※【R1R2S2】for a detailed explanationhere.
In recent Investment Navi+ articles,we mainly introduce examples that show the high compatibility between various trading methods and the signals of mBDSR and R1R2S2.
USD/JPY 1-minute chart
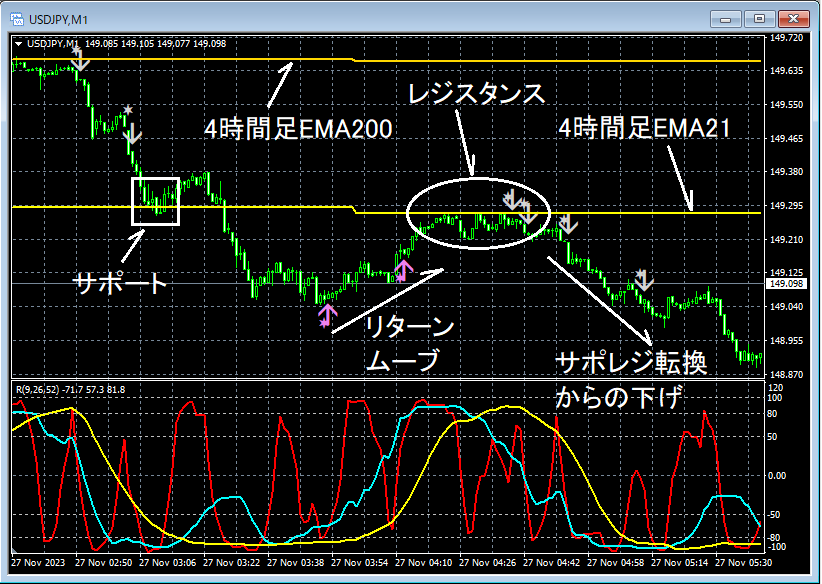
The status of the higher timeframe is omitted.
On the 1-minute chart above, a rebound started from the area around4-hour EMA200which has been acting as resistance since last week. It declined to around the 4-hour EMA21 and then briefly rose again before continuing to drop.4-hour EMA21was breached. Then,return movetonear the 4-hour EMA21had a rebound,but reversed from support/resistance turninginto a decline.
Within the range of the above chart,R1R2S2 reversal selling signals and pullback buying signalshave lit up a total of 8 times.
Indicator that delivers power in combination with RCI【BODSOR・mBDSR】
Methods and Case Studies (PDF) ★GogoJungle AWARD2020 Winner★
https://www.gogojungle.co.jp/tools/indicators/11836
283 PDF files are included.
Many of them are compiled as examples that explain sequentially the status of multiple lower timeframes by logically linking the higher and lower timeframes using three RCI lines, and ultimately waiting for the timing of buying on dips or selling on retracements on the lower timeframes (=mBDSR signals)..
Also,many focus on capturing points where multiple entry reasons coincide.
The explanations usemore than 1,000 chartsin total.

× ![]()


