
Sign of reversal support from return move, double bottom, and mBDSR (RCI2 filters)
Indicator that shines in combination with RCI【BODSOR・mBDSR】
Method and Case Studies (PDF) ★GogoJungle AWARD2020 Winner★
https://www.gogojungle.co.jp/tools/indicators/11836
The PDF file includes 283 items.
Many of them are summarized as examples that logically link higher and lower timeframes using 3-line RCI, sequentially examine the conditions of multiple lower timeframes, and finally wait for a timing to buy on dips or sell on rallies in the lower timeframes (i.e., the mBDSR signal).They are designed to illustrate this form.
Also,many focus on capturing points where multiple entry reasons overlap..
In the explanations,more than 1,000 chartsare used.

In recent Investor Navi+ articles,we present examples focusing on the high compatibility between various trading methods and the mBDSR signal..
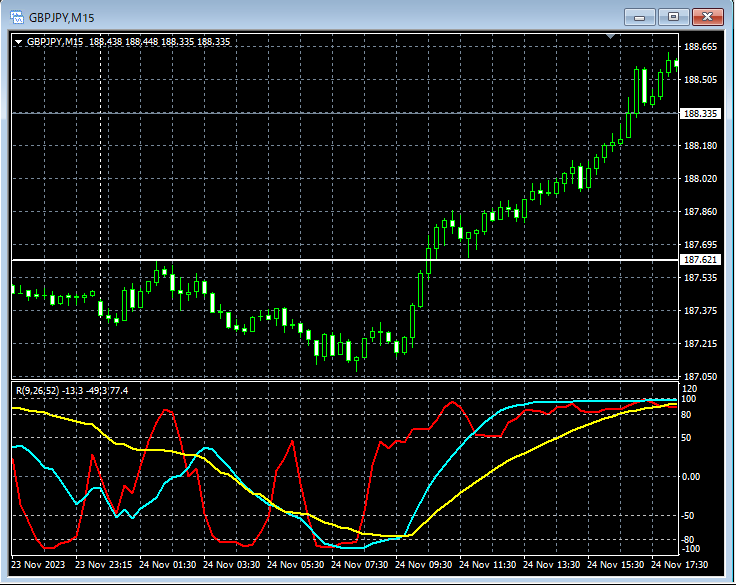
Pound/Yen 15-minute chart
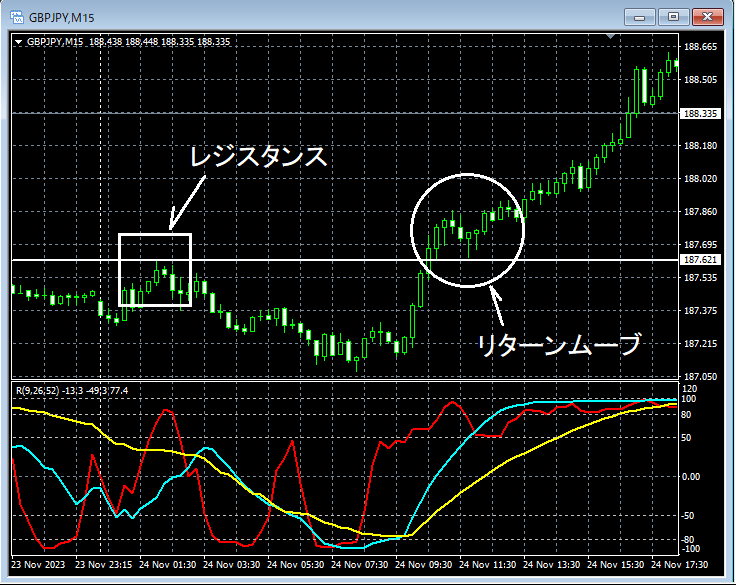
In the area circled by the white circle on the 15-minute chart above, after breaking above a line that had been functioning as resistance, it moves down to the line that had been resistance, now acting as support, with a so-calledreturn move. Depending on the higher timeframe situation, this could be a scene of a rise from a so-calledsupport-turned-resistancechange.
Pound/Yen 1-minute chart
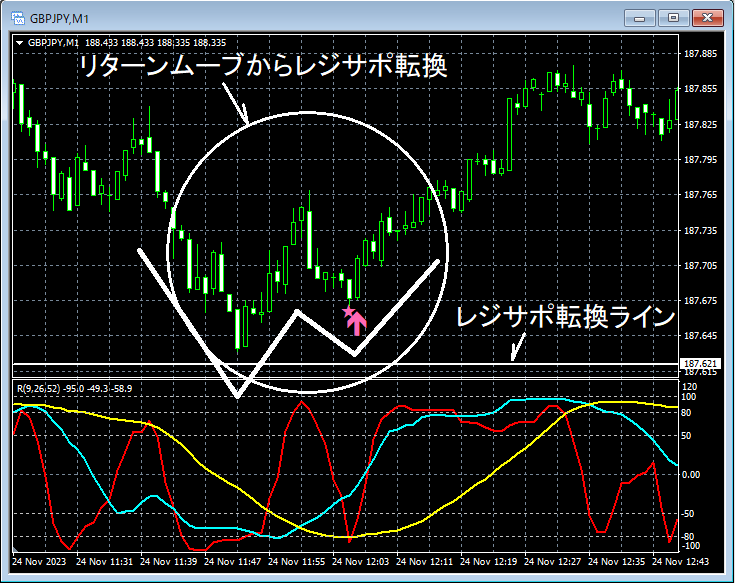
On the upper 1-minute chart, after it drops to the line that had been resistancemBDSR (filters: RCI26 and RCI52) dip-buy signal lights up, and thussupport-turned-resistance turns upward smoothly.
Additionally,a double bottom results in a dip-buy signal lighting up at the right-side trough.
From this example,a trading method focused on the return move andthe mBDSR signal show a high degree of compatibility.
Indicator that shines in combination with RCI【BODSOR・mBDSR】
Method and Case Studies (PDF) ★GogoJungle AWARD2020 Winner★
https://www.gogojungle.co.jp/tools/indicators/11836
The PDF file includes 283 items.
Many of them are summarized as examples that logically link higher and lower timeframes using 3-line RCI, sequentially examine the conditions of multiple lower timeframes, and finally wait for a timing to buy on dips or sell on rallies in the lower timeframes (i.e., the mBDSR signal).They are designed to illustrate this form.
Also,many focus on capturing points where multiple entry reasons overlap..
In the explanations,more than 1,000 chartsare used.