

■ Example of 【RCI3 single line + mBDSR sign】 (November 20 – November 24)
Indicator that excels in combination with RCI: BODSOR・mBDSR
Methods and Case Studies (PDF) ★GogoJungle AWARD 2020 Winner★
https://www.gogojungle.co.jp/tools/indicators/11836
The PDF file comes with 283 items.
Many of them are examples that break down the process into logically linking higher and lower timeframes using three RCI lines, sequentially considering the状況 of multiple lower timeframes, and ultimately waiting for pullbacks (or buying on dips) or selling on rallies timing in the lower timeframe (the mBDSR signal).This is described as.
Also,many focus on capturing points where multiple entry reasons coincide.
In the explanations,more than 1,000 chartsare used.

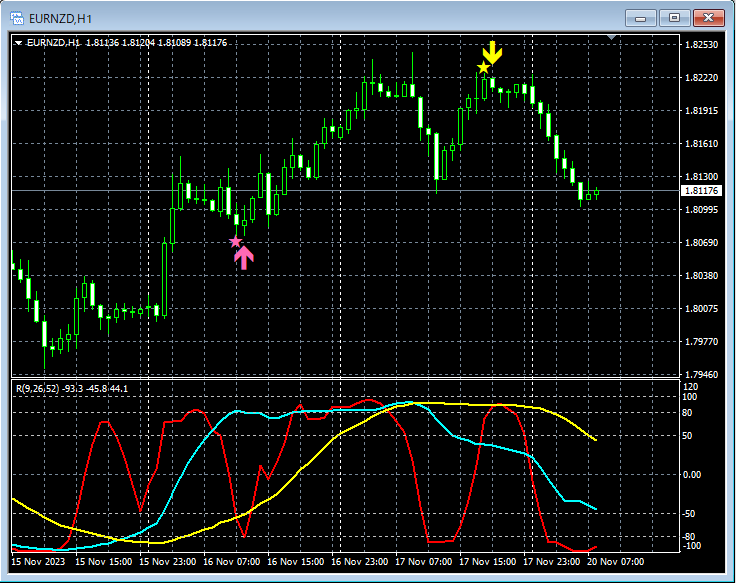
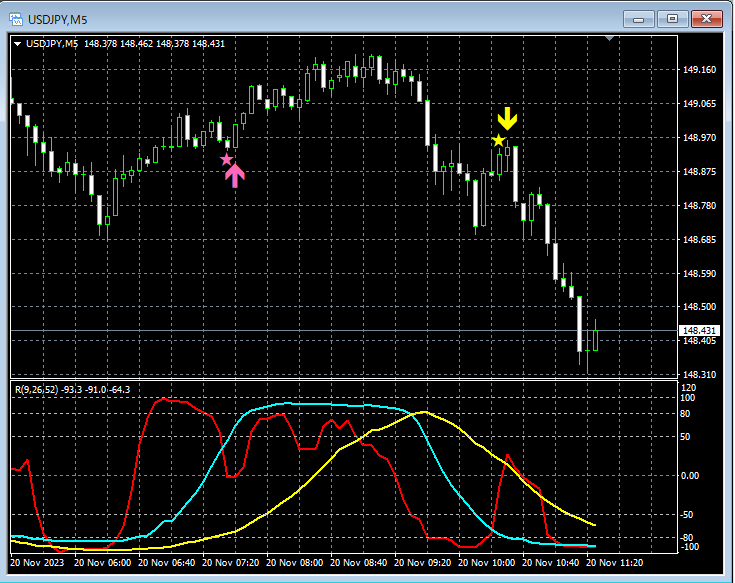
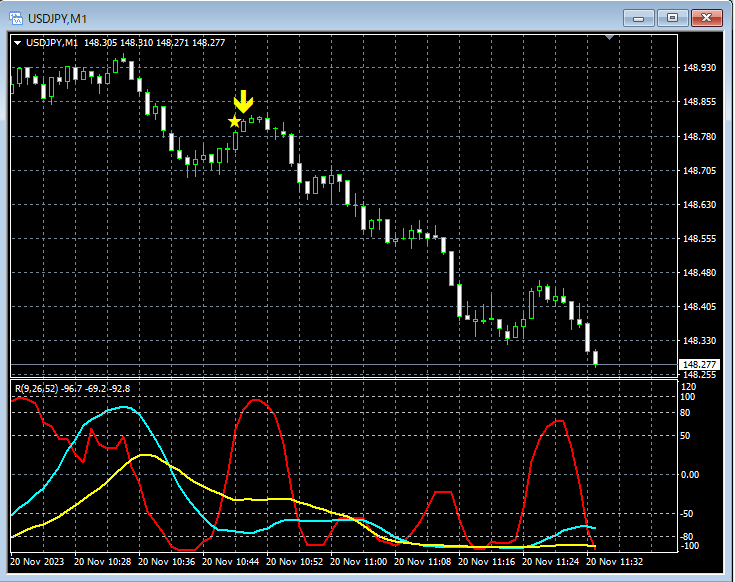
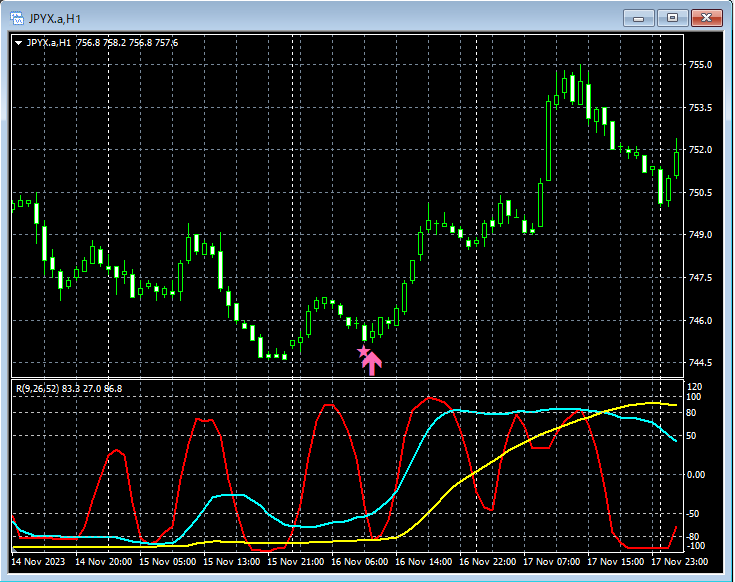
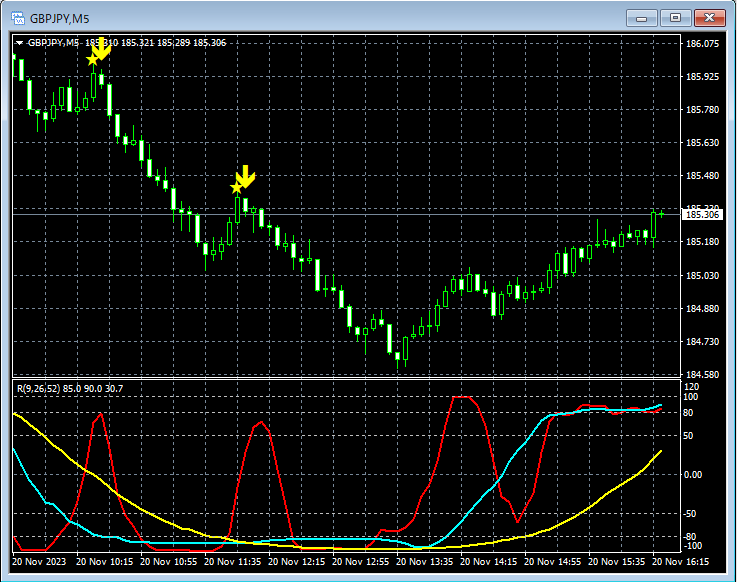
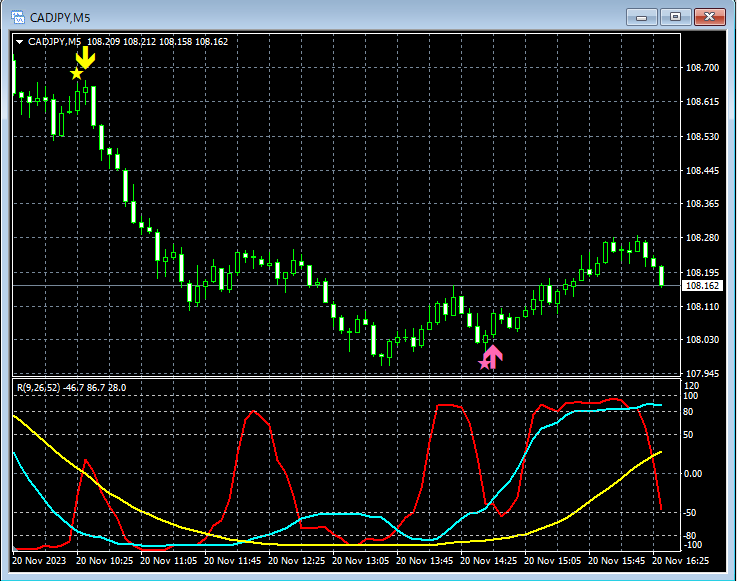
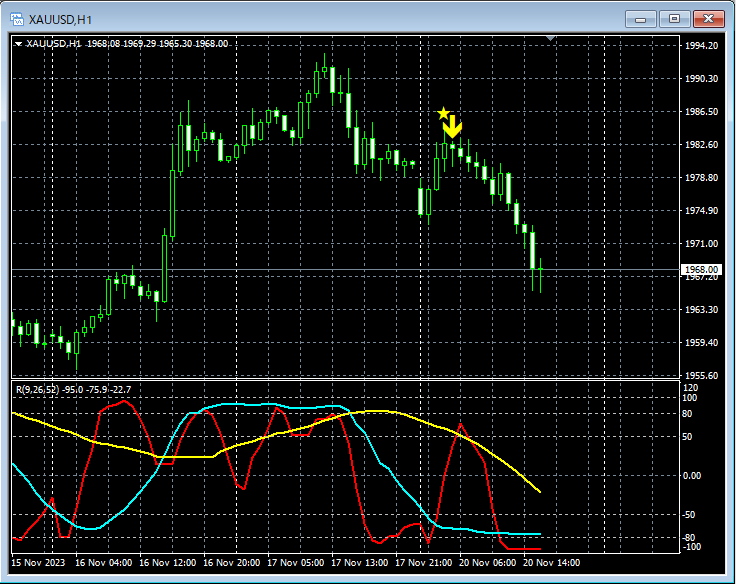
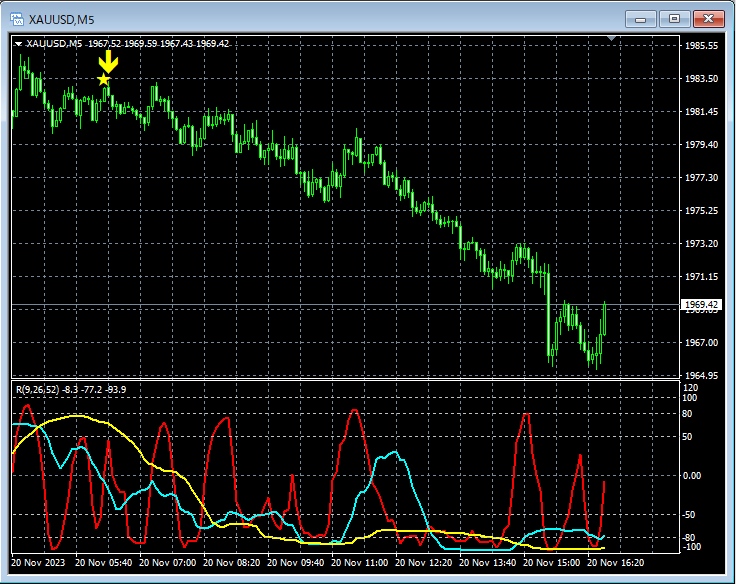
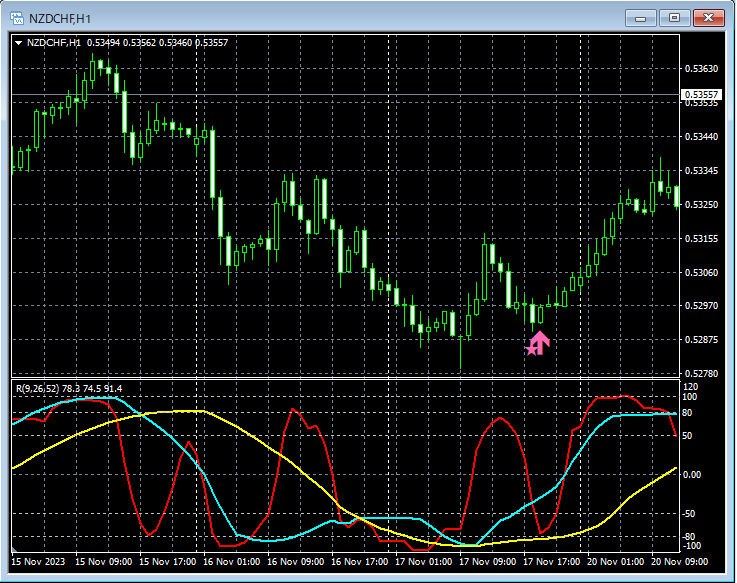
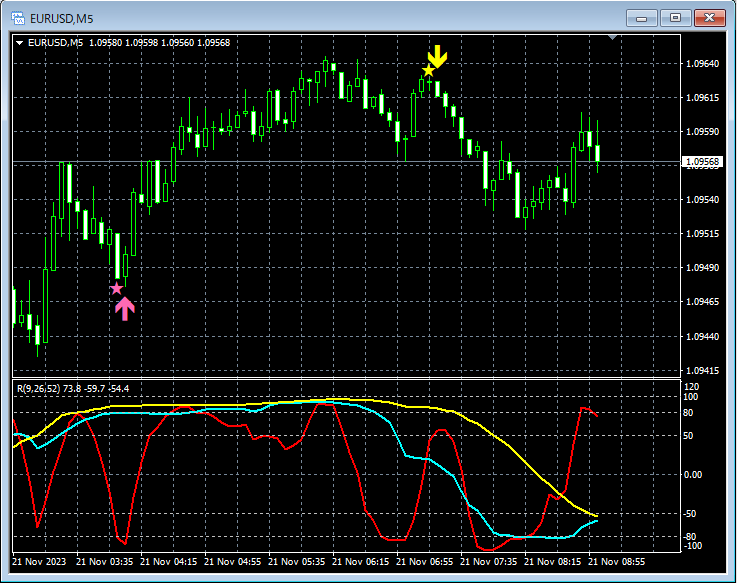
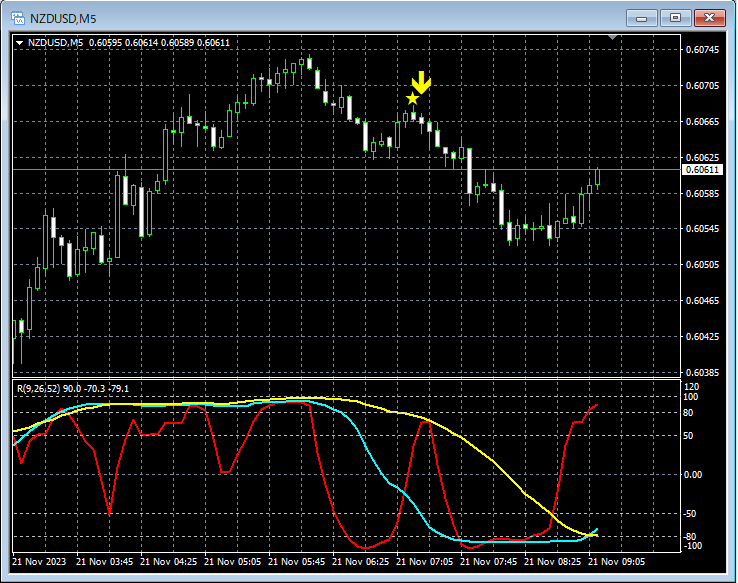
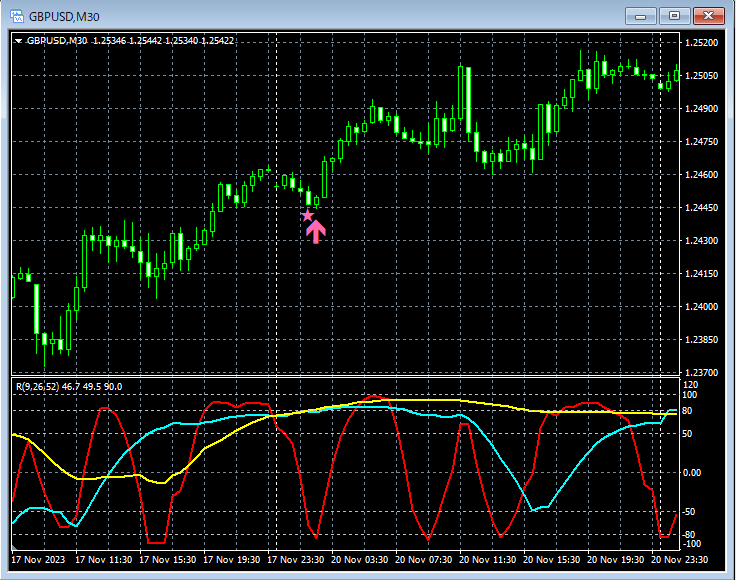
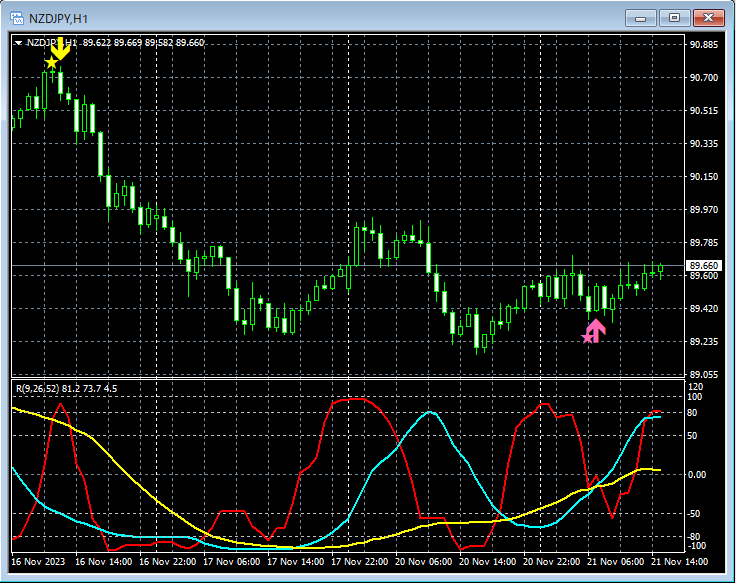
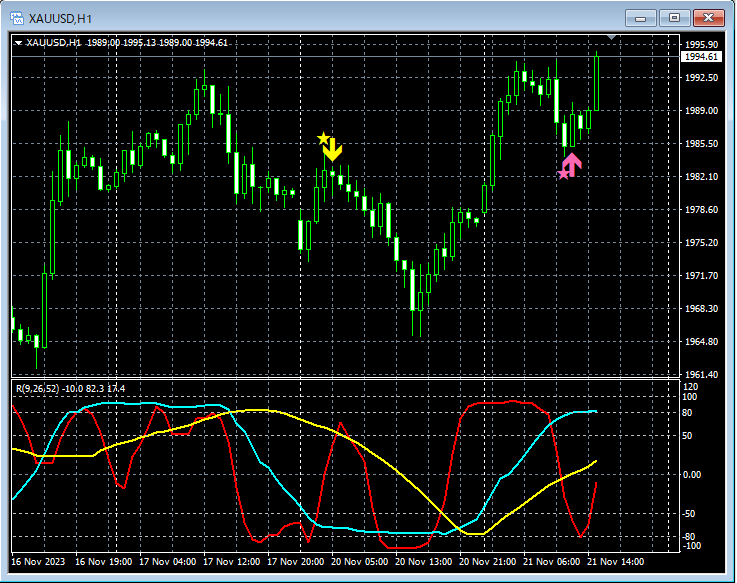
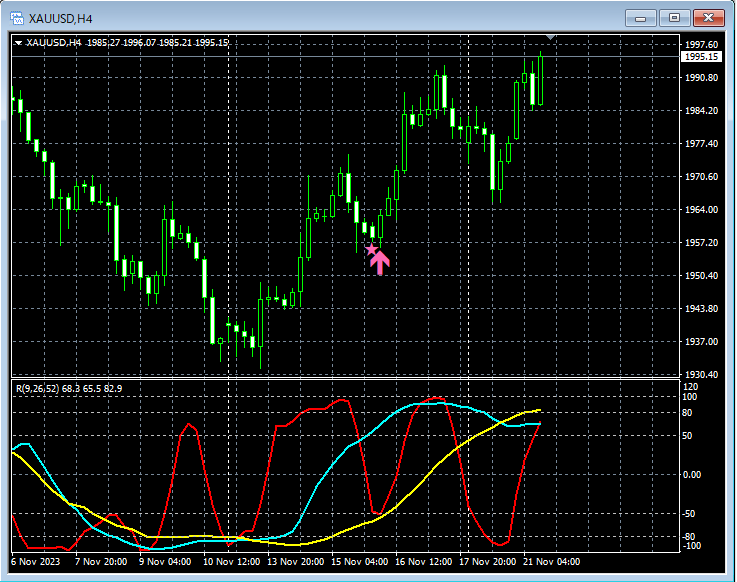
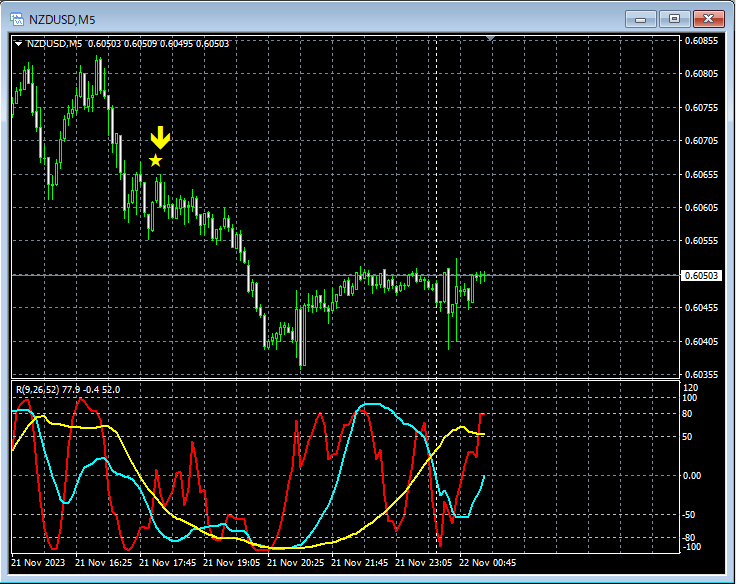
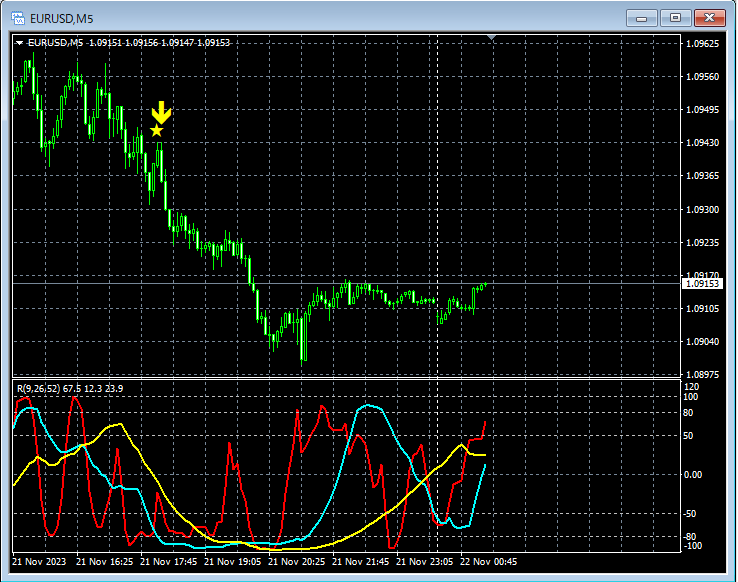
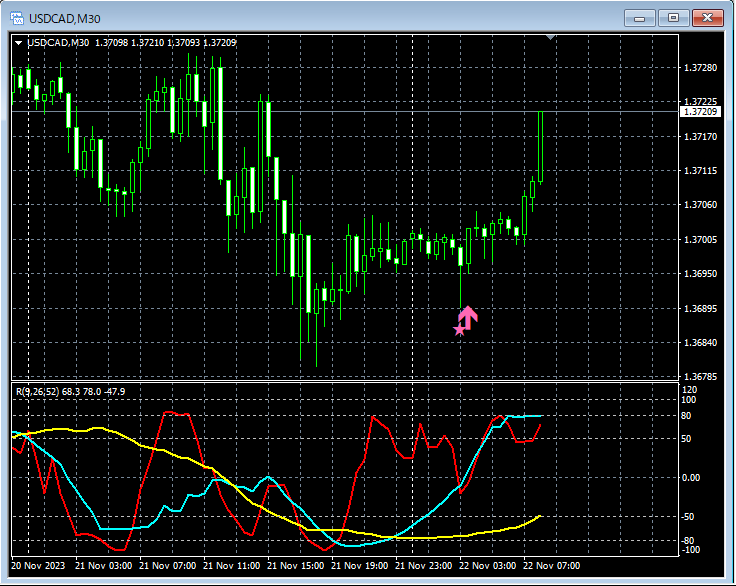
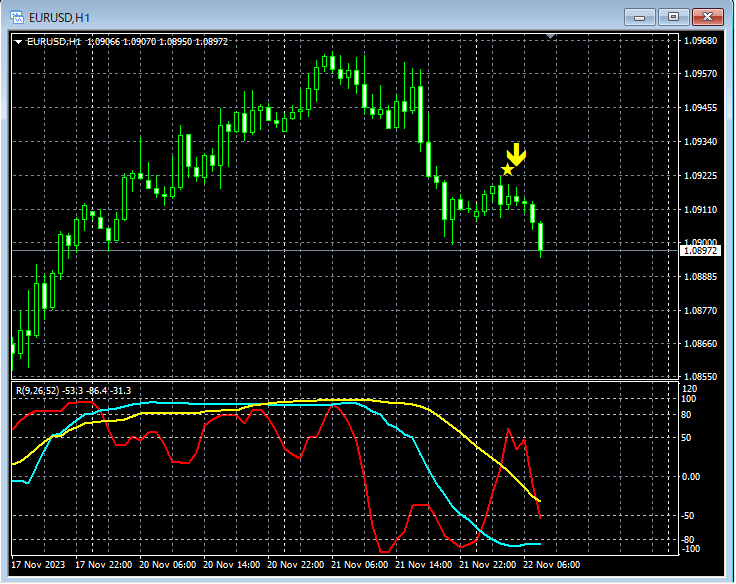
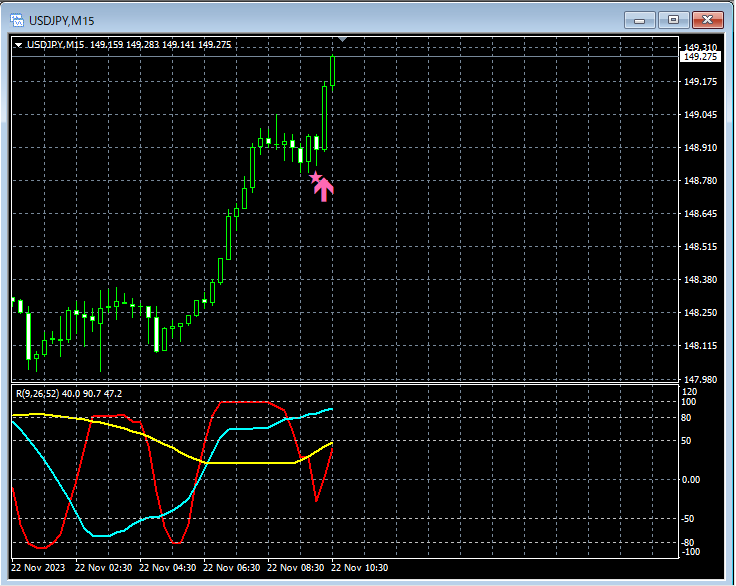
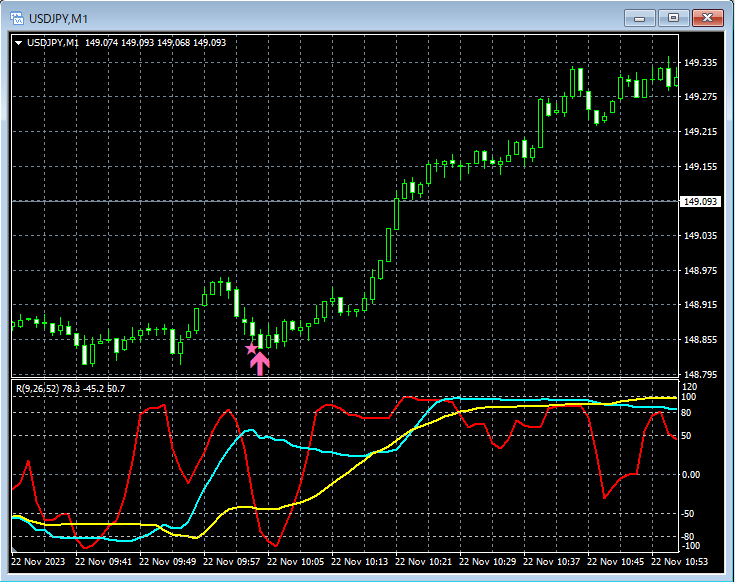
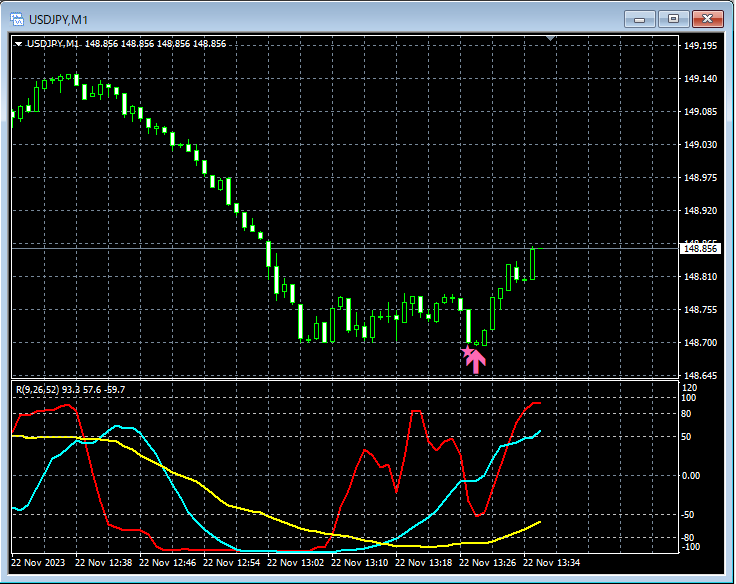
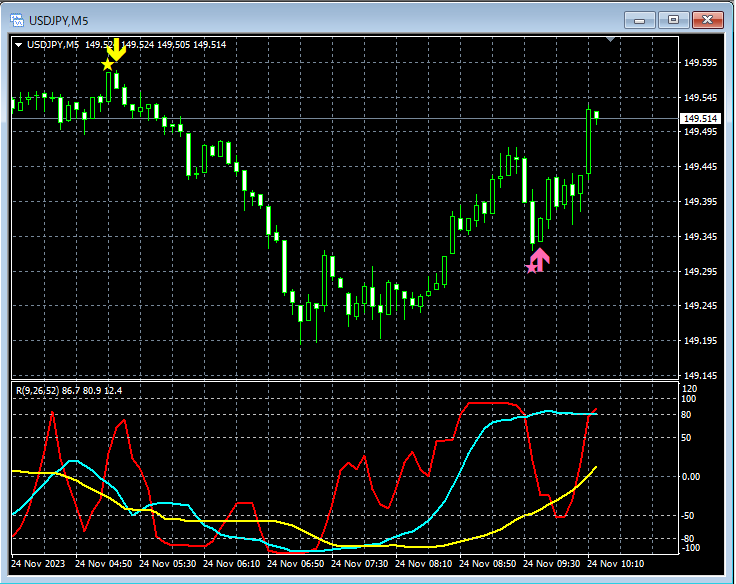
Below, from November 20 to November 24, we pick up and introduce some examples where the mBDSR (two-filter version of RCI) signals seemed to function well.
Indicator that excels in combination with RCI: BODSOR・mBDSR
Methods and Case Studies (PDF) ★GogoJungle AWARD 2020 Winner★
https://www.gogojungle.co.jp/tools/indicators/11836
The PDF file comes with 283 items.
Many of them are examples that break down the process into logically linking higher and lower timeframes using three RCI lines, sequentially considering the状況 of multiple lower timeframes, and ultimately waiting for pullbacks (or buying on dips) or selling on rallies timing in the lower timeframe (the mBDSR signal)..
Also,many focus on capturing points where multiple entry reasons coincide.
In the explanations,more than 1,000 chartsare used.
× ![]()


