

Dollar Index: Fibonacci Retracement and Fibonacci Extension and mBDSR (RCI2 Filters) Signals and Double Bottom
0
Indicator that shines when combined with RCI【BODSOR・mBDSR】
and methods / case studies (PDF) ★GogoJungle AWARD2020 winner★
https://www.gogojungle.co.jp/tools/indicators/11836
283 PDF files are included.Many of them areexamples that logically link higher and lower timeframes using 3 RCI lines to progressively examine the conditions of multiple lower timeframes, and finally wait for the timing to buy on dips or sell on rallies on the lower timeframe (the mBDSR signals).are compiled. The explanation usesmore than 1,000 charts.

In recent Investor Navi+ articles,we focus on examples that show the high compatibility between various trading methods and mBDSR signalsto help you understand.
Dollar Index Weekly
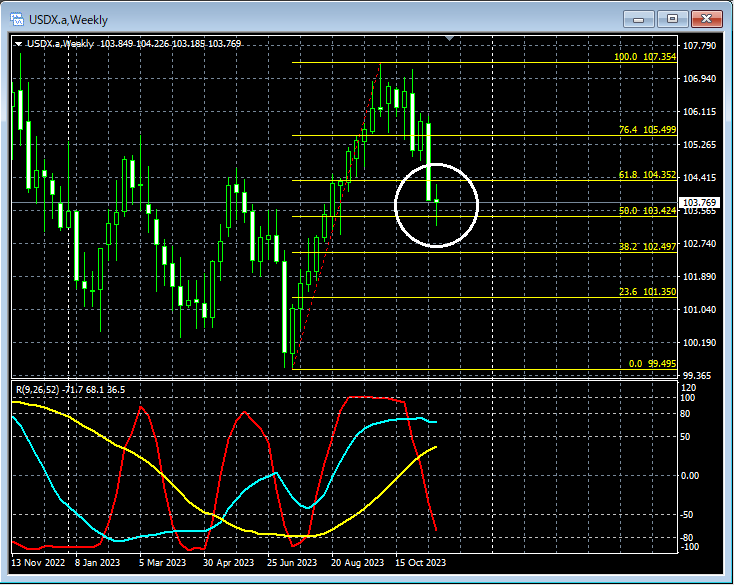
Looking at the area circled in white on the weekly chart above,Fibonacci Retracement 50.0%is near the bottom.
Dollar Index Daily
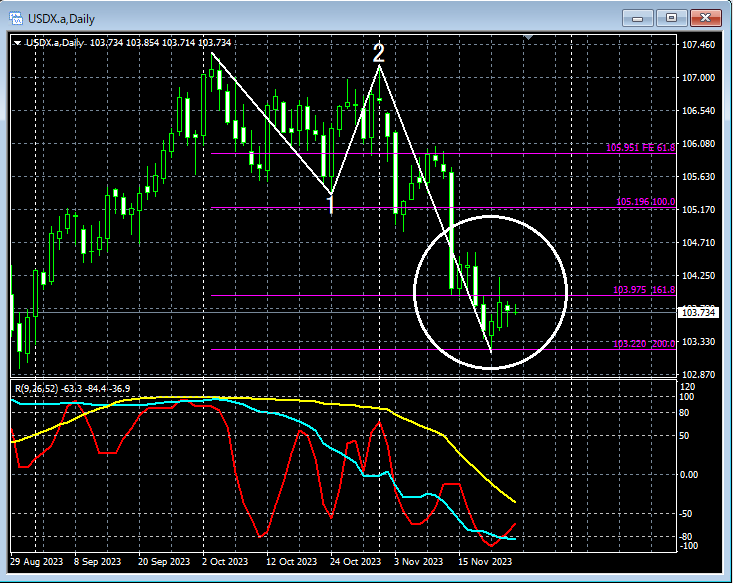
Looking at the area circled in white on the daily chart above,Fibonacci Extension 200.0%is near the bottom. Considering the aforementionedFibonacci Retracement 50.0%near it, it might be at a level where a rise is not surprising.
Dollar Index 30-Minute
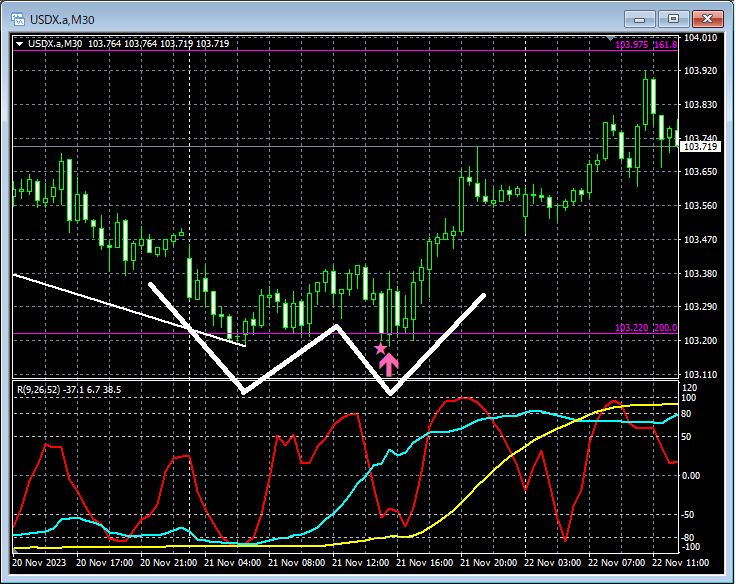
Using three RCI lines to drop from the daily to the lower timeframes is possible, but omitted here. Details of that method are left to the included PDF files.
In the 30-minute chart abovemBDSR (Filter: RCI26 and RCI52) dip-buy signallights up and climbs steadily.
As a resultthe right-side valley of the double bottom shows a dip-buy signal and rises.
From this example,the high compatibility between trading techniques focusing on Fibonacci Retracement, Fibonacci Extension, and Double BottomandmBDSR signalsis evident.
Indicator that shines in combination with RCI【BODSOR・mBDSR】
and methods / case studies (PDF) ★GogoJungle AWARD2020 winner★
https://www.gogojungle.co.jp/tools/indicators/11836
283 PDF files are included.Many of them areexamples that logically link higher and lower timeframes using 3 RCI lines to progressively examine the conditions of multiple lower timeframes, and finally wait for the timing to buy on dips or sell on rallies on the lower timeframe (the mBDSR signals).are compiled. The explanation usesmore than 1,000 charts.

× ![]()


