

Yen Index: Sell signal at a noticeable low, pin bar, head-and-shoulders, and mBDSR (RCI2-band filter) return sell signal
An indicator that demonstrates power when used with RCI: BODSOR・mBDSR
Method and Case Studies (PDF) ★GogoJungle AWARD2020 Winner★
https://www.gogojungle.co.jp/tools/indicators/11836
The PDF file comes with 283 items.
Many of them are examples that have been condensed into a form that uses three RCI lines to logically link higher and lower timeframes, sequentially examining the conditions of multiple lower timeframes and ultimately waiting for the timing to buy on dips or sell on rallies on the lower timeframe (i.e., the mBDSR signal)..
Also,many focus on identifying points where multiple entry reasons overlap..
The explanation usesover 1,000 charts.

In recent Investment Navigation+ articles,we showcase examples that illustrate the strong compatibility between various trading methods and the mBDSR signals..
Yen Index Daily
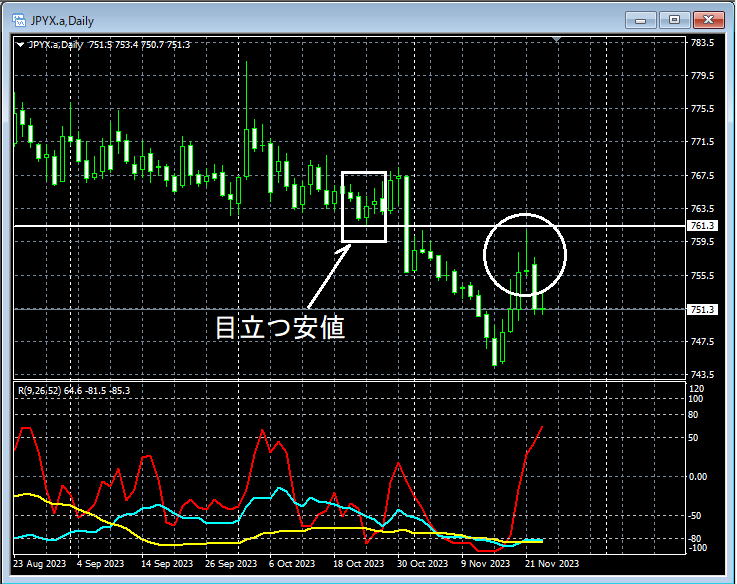
Around the area circled in white on the daily chart, it often acts as resistancepronounced lowlines indicate proximity to a notable low,a long upper shadow (pin bar)appears, suggesting further downside may occur.
Yen Index 1-Hour
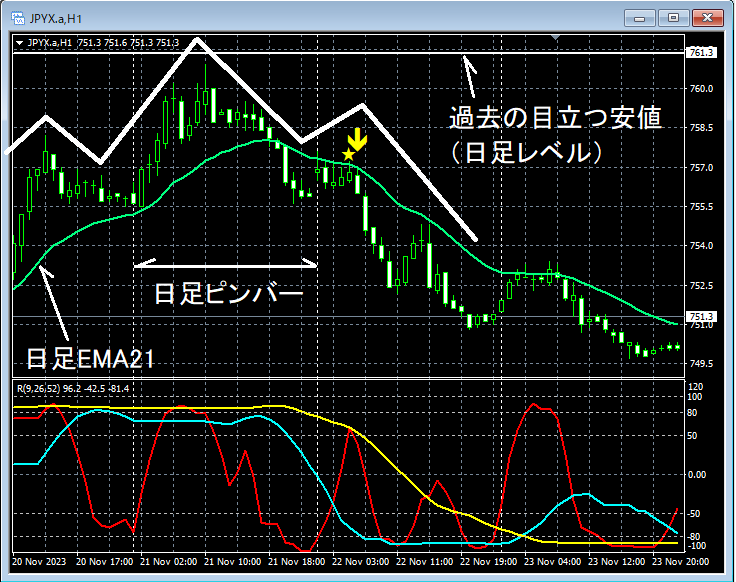
On the daily chartPin barforming, the upper 1-hour timeframe1-hour EMA21has fallen below, and considering the daily situation, the possibility of a decline is heightened.
After a dailyPin barappears, on the upper 1-hour timeframe,1-hour EMA21rises toward the vicinity,mBDSR (filter: RCI26 and RCI52) rally-back signallights up and declines smoothly.
As a result,Head and shoulders's right shoulder shows a rally-back signal
From this example,there is a strong compatibility between trades focusing on pin bars, moving averages, and head-and-shoulders patternsandmBDSR signals.
An indicator that demonstrates power when used with RCI: BODSOR・mBDSR
Method and Case Studies (PDF) ★GogoJungle AWARD2020 Winner★
https://www.gogojungle.co.jp/tools/indicators/11836
The PDF file comes with 283 items.
Many of them are examples that have been condensed into a form that uses three RCI lines to logically link higher and lower timeframes, sequentially examining the conditions of multiple lower timeframes and ultimately waiting for the timing to buy on dips or sell on rallies on the lower timeframe (i.e., the mBDSR signal)..
Also,many focus on identifying points where multiple entry reasons overlap..
The explanation usesover 1,000 charts.

× ![]()


