

Pin Bar, Return High, EMA21, Inverse Head and Shoulders, and mBDSR (RCI 2-line filter) signals
An indicator that shows power when combined with RCI【BODSOR・mBDSR】
and methods・case studies (PDF) ★GogoJungle AWARD2020 winner★
https://www.gogojungle.co.jp/tools/indicators/11836
283 PDF files are included.
Many of them are examples that have been distilled into a form where, by using three RCI lines to logically link higher and lower timeframes, the situations of multiple lower timeframes are sequentially considered, ultimately waiting for a pullback buying timing or a pullback selling timing (the mBDSR signal) on the lower timeframe..
Also,many of them focus on capturing points where multiple entry rationale overlap..
The explanation usesover 1,000 charts.

In recent Investor Navi+ articles,we highlight examples that show the high compatibility between various trading methods and the mBDSR signals.
Canadian Dollar/Yen Daily
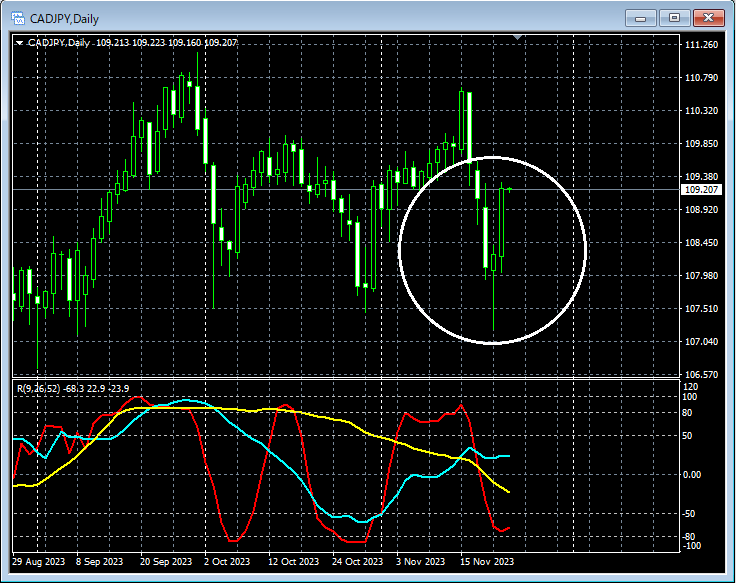
Around the area circled in white on the daily chart,a long lower shadow candle (pin bar)appears, suggesting there may be another rebound.
Canadian Dollar/Yen 1-Hour
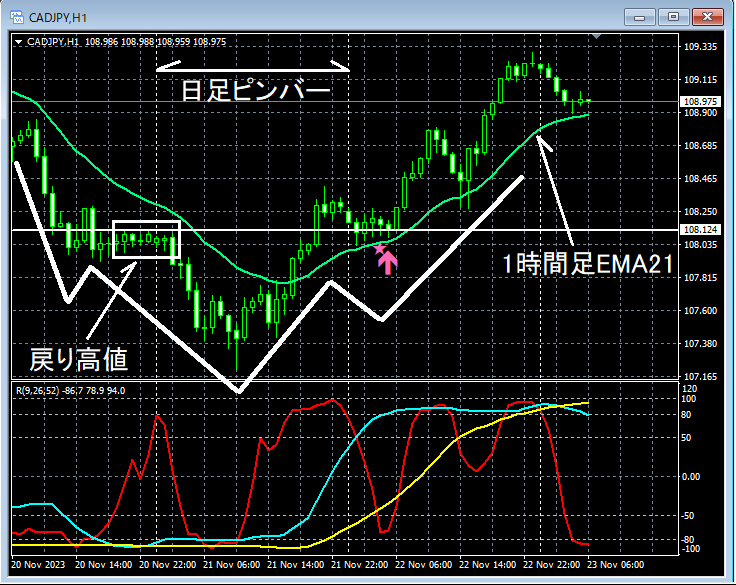
While the daily is forming a pin bar, on the upper 1-hour chart the 1-hour EMA21 has broken above the retrace high, suggesting a higher likelihood of an upward move.
After a pin bar appears on the daily, on the upper 1-hour chart the price falls to around where the 1-hour EMA21 and the retrace high coincide,mBDSR (Filter: RCI26 and RCI52) pullback buying signallights up and rises smoothly.
As a result,a right shoulder of an inverted head and shoulderspullback buying signal lights up on the right shoulder.
From this example,a high compatibility between pin bar-focused trading methodsandmBDSR signalsbecomes evident.
An indicator that shines when combined with RCI: 【BODSOR・mBDSR】
and methods・case studies (PDF) ★GogoJungle AWARD2020 winner★
https://www.gogojungle.co.jp/tools/indicators/11836
283 PDF files are included.
Many of them are examples that have been distilled into a form where, by using three RCI lines to logically link higher and lower timeframes, the situations of multiple lower timeframes are sequentially considered, ultimately waiting for a pullback buying timing or a pullback selling timing (the mBDSR signal) on the lower timeframe.Also,
many of them focus on capturing points where multiple entry rationale overlap..
The explanation usesover 1,000 charts.

× ![]()


