

Dollar/Yen: Sell signal on pullback using EMA200, Fibonacci retracement, and mBDSR (RCI two-filter)
0
Indicator that demonstrates power in combination with RCI【BODSOR・mBDSR】
Method and Case Study (PDF) ★GogoJungle AWARD2020 Winner★
https://www.gogojungle.co.jp/tools/indicators/11836
The PDF file comes with 283 attachments.Many of them are examples that break down the logic of linking higher and lower timeframes using three RCI lines, examining multiple lower-timeframe conditions sequentially, and ultimately waiting for pullback buying or pullback selling timing on the lower timeframe (i.e., the mBDSR signal).They also emphasize identifying points where multiple entry reasons align.Explanation usesmore than 1,000 charts.

In recent Investor Navi+ articles,examples that show the high affinity between various trading methods and mBDSR signalsare presented focusing on understanding.
Dollar-yen 4-hour chart
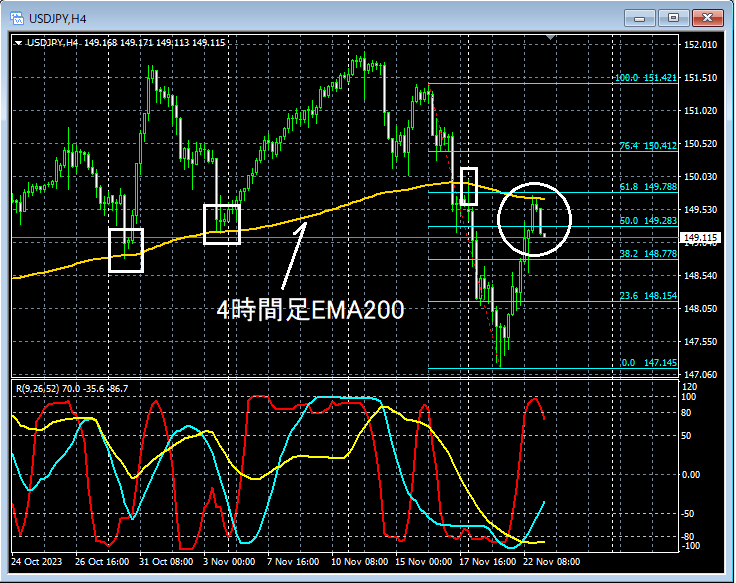
Around the area circled in white on the daily chart above, which has historically functioned as support/resistance,the 4-hour EMA200andFibonacci retracement 61.8%converge, suggesting a possible pullback.
Dollar-yen 15-minute chart
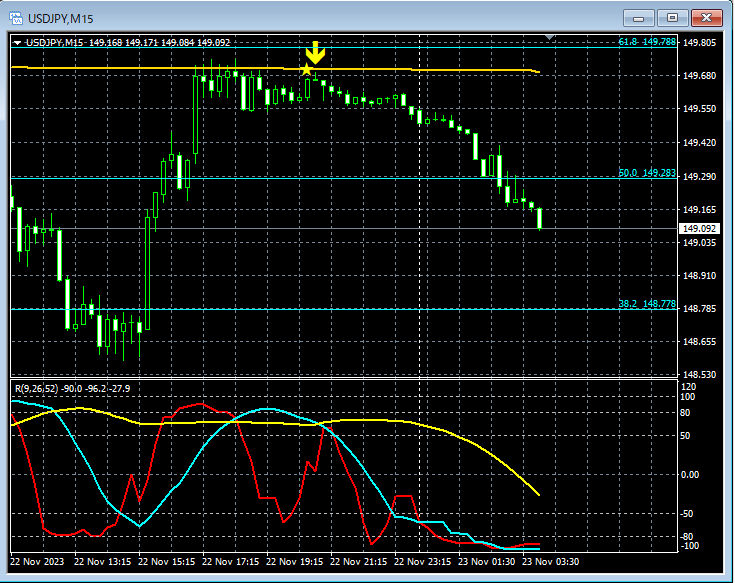
On the upper 15-minute chart,the 4-hour EMA200andFibonacci retracement 61.8%mBDSR (filter: RCI26 and RCI52) pullback selling signallights up and it is moving down smoothly.
From this example,a trading method focused on moving averagesanda trading method focused on Fibonacci retracementandmBDSR signalsshow high compatibility.
Also, in this example,placing a stop loss just slightly above the recent highallows forhigh reward-to-risk tradingopportunities.
Indicator that demonstrates power in combination with RCI【BODSOR・mBDSR】
Method and Case Study (PDF) ★GogoJungle AWARD2020 Winner★
https://www.gogojungle.co.jp/tools/indicators/11836
The PDF file comes with 283 attachments.Many of them are examples that break down the logic of linking higher and lower timeframes using three RCI lines, examining multiple lower-timeframe conditions sequentially, and ultimately waiting for pullback buying or pullback selling timing on the lower timeframe (i.e., the mBDSR signal).They also emphasize identifying points where multiple entry reasons align.Explanation usesmore than 1,000 charts.

× ![]()


