

Dollar/Yen: signals of the inverse head-and-shoulders within the push low, the pin bar, and the inverse head-and-shoulders inside the inverse head-and-shoulders, and the mBDSR (RCI two-filter) signs
0
Indicator that shows power in combination with RCI【BODSOR・mBDSR】
Methods and Case Studies (PDF) ★GogoJungle AWARD2020 winner★
https://www.gogojungle.co.jp/tools/indicators/11836
The PDF file comes with 283 items.
Many of them are examples that break down the process of logically linking higher and lower timeframes using the RCI three-line setup, and ultimately waiting for pullback buy or pullback sell signals on the lower timeframe (i.e., mBDSR signal).They are designed to illustrate that form.
Also,many emphasize capturing points where multiple entry reasons coincide.
In the explanations,more than 1,000 chartsare used.

In a recent Investor Navi+ article,we focus on examples that show the high harmony between various trading methods and the mBDSR signals.
(1) Daily chart level pullback low and 4-hour pin bar and inverse head and shoulders and mBDSR signal
Dollar/Yen Daily
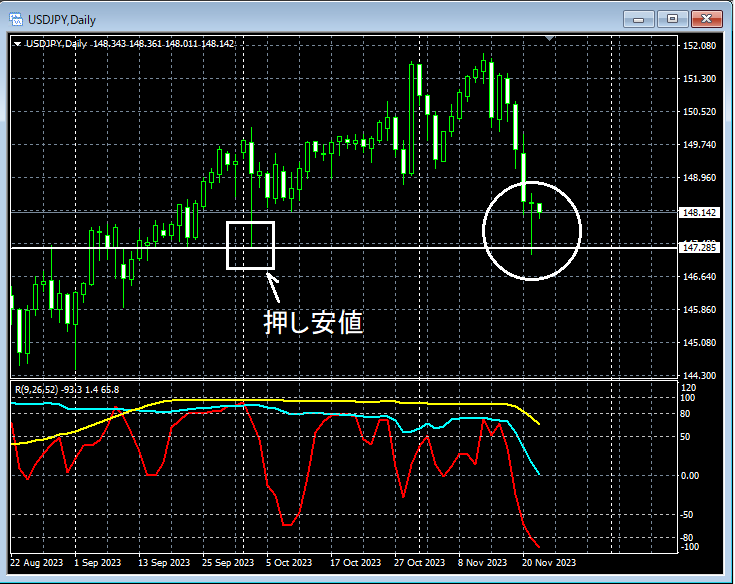
Around the area circled with a white circle on the daily chart,pullback lowhas been reached, so a rebound might occur.
Dollar/Yen 4-hour
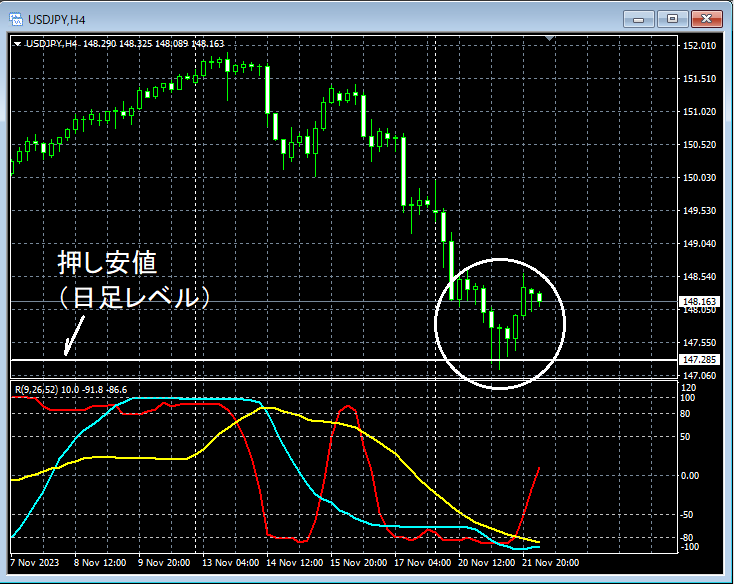
Around the area circled with a white circle above,a long lower wick candle (pin bar)has appeared, so a rebound might occur.
Dollar/Yen 15-minute
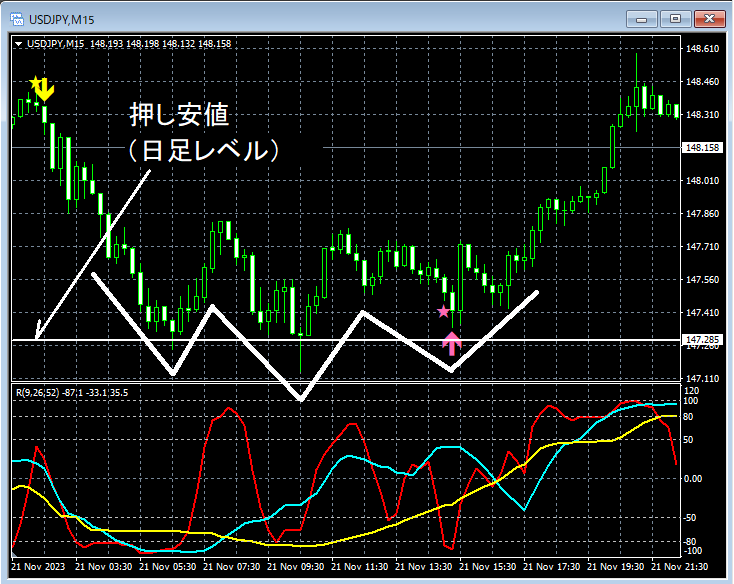
After the pin bar appeared on the 4-hour chart, on the upper 15-minute chartmBDSR (filter: RCI26 and RCI52) pullback buy signallights up and rises smoothly.
As a result,inverse head and shouldersright shoulder pullback buy signal lights up.
(2) Daily chart level pullback low and daily pin bar and inverse head and shoulders and mBDSR signal
Dollar/Yen Daily
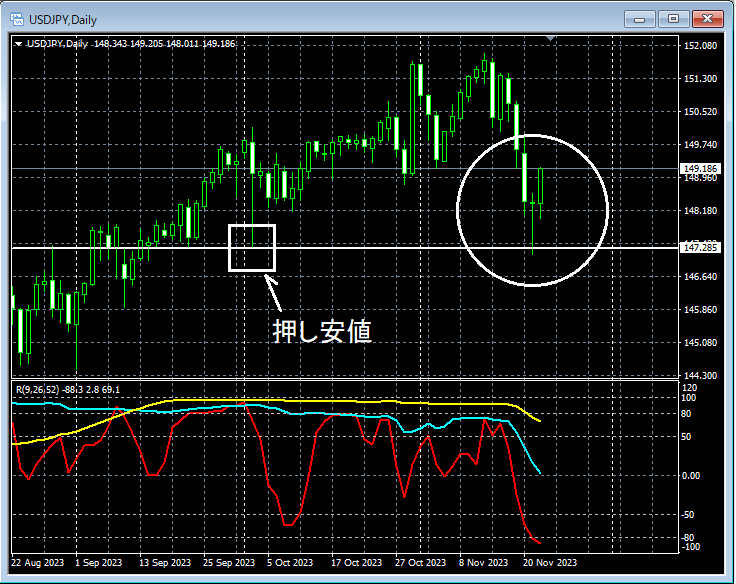
Around the area circled with a white circle on the daily chart,pullback lowhas dropped to,a long lower wick candle (pin bar)has appeared, indicating potential further rebound.
Dollar/Yen 1-hour
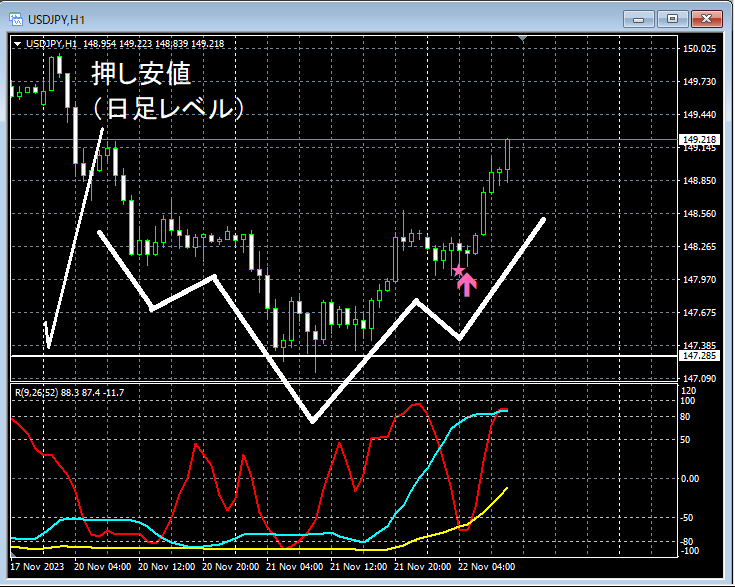
After a pin bar appeared on the daily chart, on the upper 1-hour chartmBDSR (filter: RCI26 and RCI52) pullback buy signallights up and rises smoothly.
As a result,the right shoulder of the inverse head and shoulderspullback buy signal lights up.
(3) Inverse head and shoulders inside inverse head and shoulders and mBDSR signal
Dollar/Yen 1-hour
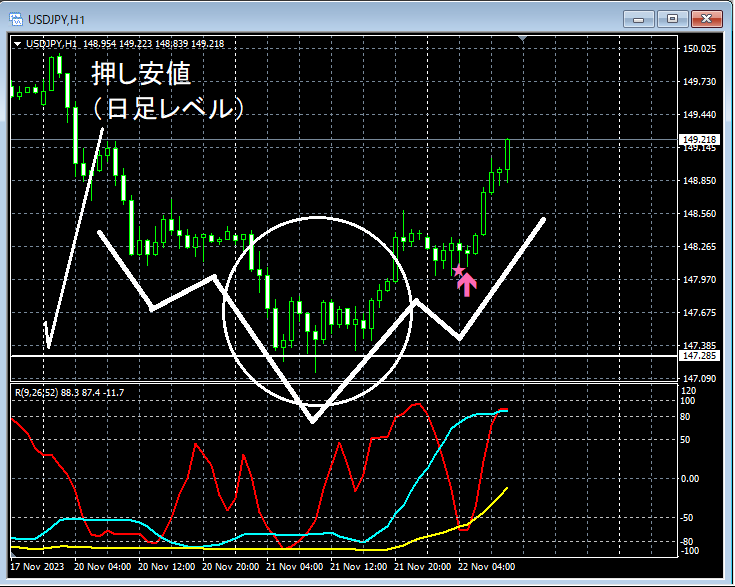
On the upper 1-hour chart as described above,inverse head and shouldersis formed. Here, let’s look at the circled area on the 15-minute chart.
Dollar/Yen 15-minute
On the upper 15-minute chart, as described above,inverse head and shouldersis formed. In other words, in the middle valley of the 1-hour chart’sinverse head and shouldersthe 15-minute chart forms aninverse head and shouldersinside it. In other words,“an inverse head and shoulders within an inverse head and shoulders”
If opportunity arises,we will also cover the “double bottom (double top) within a double bottom (double top)”formation.
From this example,a trading method focused on the pullback lowanda trading method focused on pin barsandinverse head and shouldersmBDSR signals
Additionally, in this example,placing a stop-loss slightly below the recent lowis recommended,enabling high risk-reward trades.
Indicator that shines in combination with RCI【BODSOR・mBDSR】
and its methods and case studies (PDF) ★GogoJungle AWARD2020 winner★
https://www.gogojungle.co.jp/tools/indicators/11836
The PDF file comes with 283 items.
Many of them are examples that break down the process of logically linking higher and lower timeframes using the RCI three-line setup, and ultimately waiting for pullback buy or pullback sell signals on the lower timeframe (i.e., mBDSR signal).
Also,many emphasize capturing points where multiple entry reasons coincide.
In the explanations,more than 1,000 chartsare used.

× ![]()


