

Capture the points where the grounds for entries overlap multiple times — RCI three lines + mBDSR sign — November 22, 2023
0
Indicators that shine when used in combination with RCI【BODSOR・mBDSR】
Methods and Case Studies (PDF) ★GogoJungle AWARD2020 Winner★
https://www.gogojungle.co.jp/tools/indicators/11836
The PDF file includes 283 items.Most of them are examples that break down the process of logically linking higher and lower timeframes using the 3-line RCI, sequentially examining the conditions of multiple lower timeframes, and ultimately waiting for a timing to buy on dips or sell on rallies in the lower timeframe (i.e., the mBDSR signal).Explanation usesover 1,000 charts in total.

In recent Investor Navi+ articles,we focus on examples that illustrate the high compatibility between various trading methods and the mBDSR signals.These are highlighted in particular.
NZDUSD 30-minute chart
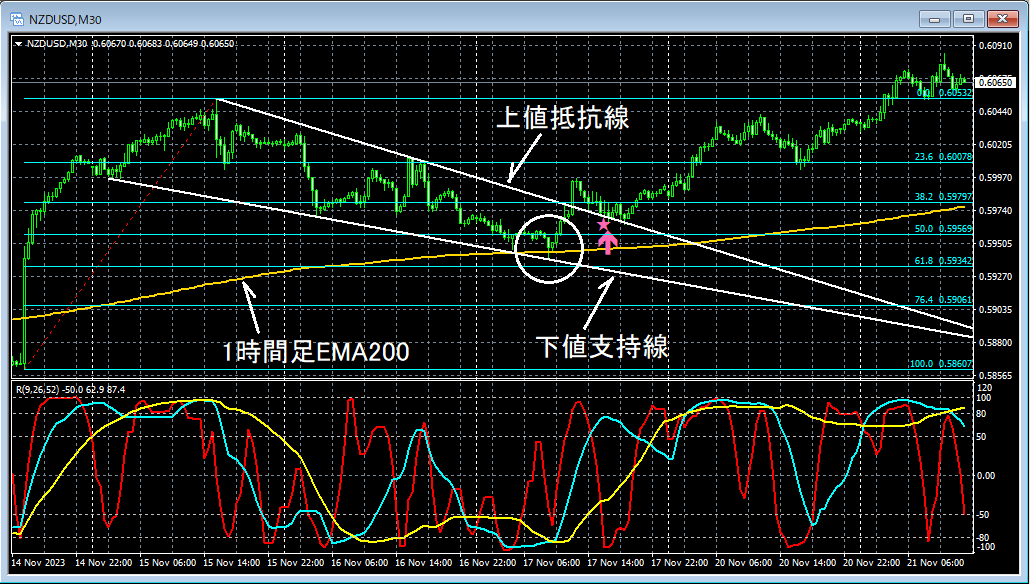
Multiple entry reasons
(1) Rebound near the 1-hour EMA200
(2) Rebound near the Fibonacci retracement 61.8%
(3)Wedgerebound from the lower support line
(4)Wedgebreak above the upper resistance line
(5)Wedgepullback toward near the upper resistance line (possible support/resistance reversal)
(6)mBDSR (Filter: RCI26 and RCI52) buy-on-dip signallit
(7) Entry reasoning on higher timeframe (omitted)
From this example,the compatibility between wedge-focused trading methodsandthe mBDSR signalis evident
Indicators that shine when used in combination with RCI【BODSOR・mBDSR】
Methods and Case Studies (PDF) ★GogoJungle AWARD2020 Winner★
https://www.gogojungle.co.jp/tools/indicators/11836
The PDF file includes 283 items.Most of them are examples that break down the process of logically linking higher and lower timeframes using the 3-line RCI, sequentially examining the conditions of multiple lower timeframes, and ultimately waiting for a timing to buy on dips or sell on rallies in the lower timeframe (i.e., the mBDSR signal).Explanation usesover 1,000 charts in total.
× ![]()


