

Recent dollar/yen movements November 21, 2023
0
Indicator that shines when combined with RCI【BODSOR・mBDSR】
Methods and Case Studies (PDF) ★GogoJungle AWARD2020 Winner★
https://www.gogojungle.co.jp/tools/indicators/11836
283 PDF files are included.Many of them areexamples that break down how to logically link higher and lower timeframes using the 3-line RCI so as to sequentially consider the conditions of multiple lower timeframes, ultimately waiting for pullbacks in the lower timeframe (the mBDSR signal).described. The explanations usemore than 1,000 charts in total..

In recent Investor Navigation+ articles,we showcase examples that illustrate the high compatibility between various trading methods and the mBDSR signals.
Dollar/Yen 4-hour chart
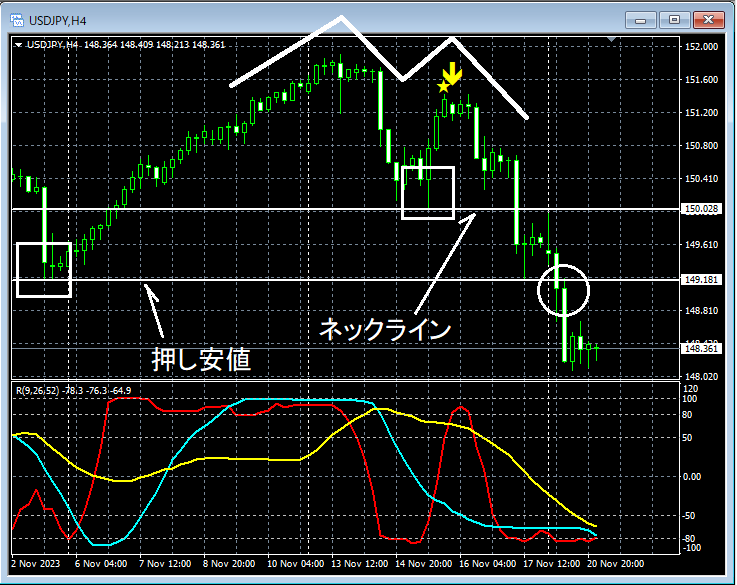
On the 4-hour chart above,the right peak of the double topshowsthe mBDSR pullback sell signallighting up and price declines.The neckline of the double topandthe swing loware broken below, leading to a sharp drop.We will look at the area just below the swing low (surrounded by a white circle) on the 5-minute chart.Dollar/Yen 5-minute chartUsing the 3-line RCI, you can logically drill down from the 4-hour chart to the lower timeframes, but the details of that method aredelegated to the attached PDF file.On the 5-minute chart above,near the past swing low on the 4-hour chartthe price fell back after a retracement,the mBDSR pullback sell signalbecame active and the price declined smoothly.From this example,it is clear that there is a strong compatibility between trading strategies that focus on double tops and swing lows andthe mBDSR signals.Indicator that shines when combined with RCI【BODSOR・mBDSR】Methods and Case Studies (PDF) ★GogoJungle AWARD2020 Winner★https://www.gogojungle.co.jp/tools/indicators/11836283 PDF files are included.Many of them areexamples that break down how to logically link higher and lower timeframes using the 3-line RCI so as to sequentially consider the conditions of multiple lower timeframes, ultimately waiting for pullbacks in the lower timeframe (the mBDSR signal).described. The explanations usemore than 1,000 charts in total..
Dollar/Yen 5-minute chart
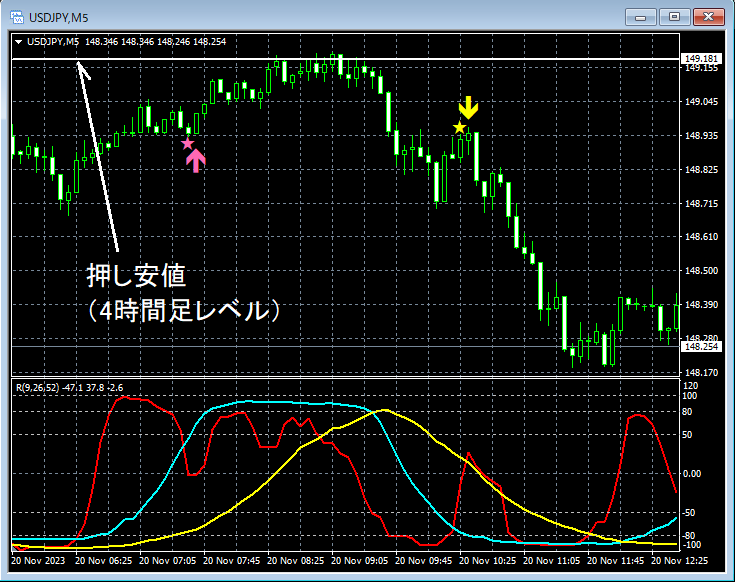
Using the 3-line RCI, you can logically drill down from the 4-hour chart to the lower timeframes, but the details of that method aredelegated to the attached PDF file.
On the 5-minute chart above,near the past swing low on the 4-hour chartthe price fell back after a retracement,the mBDSR pullback sell signalbecame active and the price declined smoothly.
From this example,it is clear that there is a strong compatibility between trading strategies that focus on double tops and swing lows andthe mBDSR signals.
Indicator that shines when combined with RCI【BODSOR・mBDSR】
Methods and Case Studies (PDF) ★GogoJungle AWARD2020 Winner★
https://www.gogojungle.co.jp/tools/indicators/11836
283 PDF files are included.Many of them areexamples that break down how to logically link higher and lower timeframes using the 3-line RCI so as to sequentially consider the conditions of multiple lower timeframes, ultimately waiting for pullbacks in the lower timeframe (the mBDSR signal).described. The explanations usemore than 1,000 charts in total..

× ![]()


