

Trends in cross yen: engulfing pattern and mBDSR rebound selling signal
0
Indicator that shines in combination with RCI: 【BODSOR・mBDSR】
Method and Case Studies (PDF) ★GogoJungle AWARD2020 winner★
https://www.gogojungle.co.jp/tools/indicators/11836
The PDF file includes 283 attachments.Many of them explain how to logically link the higher and lower timeframes using three RCI lines, examining the conditions of multiple lower timeframes sequentially, and ultimately waiting for a buying opportunity on pullbacks or selling on retracements in the lower timeframe (i.e., the mBDSR signal).In the explanations,more than 1,000 chartsare used.

In recent Investment Navigator+ articles,we focus on examples that illustrate the high compatibility between various trading methods and mBDSR signals.
Swiss Franc-yen 4-hour chart
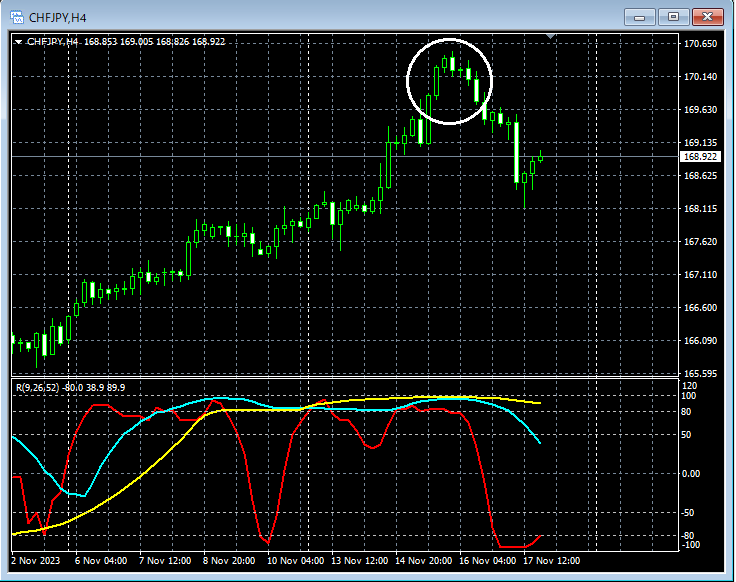
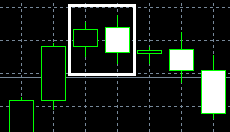
If you look at the area circled in white on the 4-hour chart above,a engulfing barappears. This candlestick pattern suggests a potential downward reversal, so considering a retracement sell on lower timeframes may not be unusual.
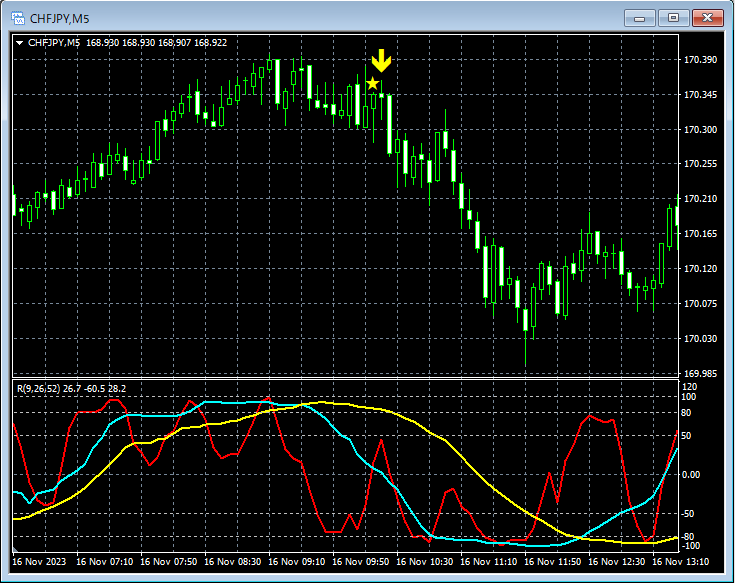
Swiss Franc-yen 5-minute chart
Using three RCI lines we can progressively drop to lower timeframes from the 4-hour chart, but this is omitted here. The method is left to the attached PDF file.
On the 4-hour chart,the engulfing barappears, and then on the upper 5-minute chartmBDSR (filters: RCI26 and RCI52) sell signallights up and the price declines smoothly.
From this example,a trade method focused on engulfing barsandthe signal of mBDSRshow a high degree of compatibility.
Indicator that shines in combination with RCI: 【BODSOR・mBDSR】
Method and Case Studies (PDF) ★GogoJungle AWARD2020 winner★
https://www.gogojungle.co.jp/tools/indicators/11836
The PDF file includes 283 attachments.Many of them explain how to logically link the higher and lower timeframes using three RCI lines, examining the conditions of multiple lower timeframes sequentially, and ultimately waiting for a buying opportunity on pullbacks or selling on retracements in the lower timeframe (i.e., the mBDSR signal).In the explanations,more than 1,000 chartsare used.
× ![]()


