

Trends in Cross JPY: Sakata Five Methods "Evening Star" and mBDSR's Sell Signal on the Rebound (1)
0
Indicator that shines when used in combination with RCI: 【BODSOR・mBDSR】
Method and Case Studies (PDF) ★GogoJungle AWARD2020 winner★
https://www.gogojungle.co.jp/tools/indicators/11836
The PDF file includes 260 items.Many of them are examples that have been compiled to logically link higher and lower timeframes using three RCI lines, then sequentially examine the状況s of multiple lower timeframes, and finally wait for a timing to enter a chasing buy or pullback sell on the lower timeframe (= mBDSR signal).The explanations usemore than 1,000 charts.

In recent Investing Navi+ articles,we mainly introduce examples that show the high compatibility between various trading methods and mBDSR signals.
New Zealand Yen 4-hour chart
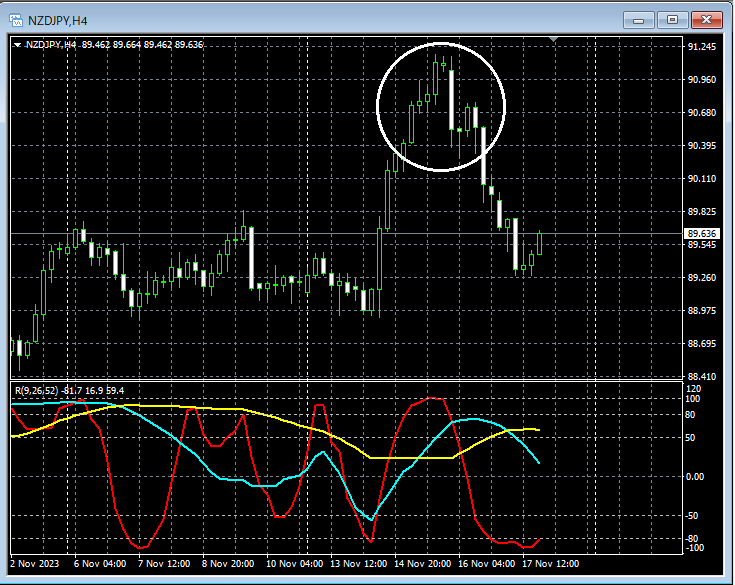
Looking at the area circled in white on the 4-hour chart above,Sakata Five Methods’ “Evening Star”appears. This candlestick pattern suggests a bearish reversal, and it may not be strange to consider selling on the retrace on the lower timeframe.
New Zealand Yen 1-hour chart
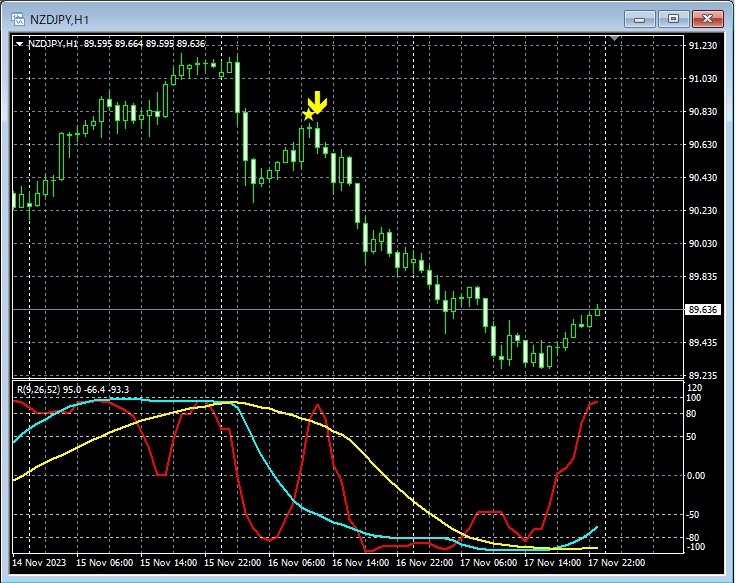
On the higher timeframe 4-hour chart, after theSakata Five Methods’ “Evening Star”appears, on the higher 1-hour chartmBDSR (Filter: RCI26 and RCI52) pullback sell signallights up and declines smoothly.
From this example,a trading method that focuses on the Sakata Five Methods’ “Evening Star”andthe mBDSR signalshowing strong compatibility
Indicator that shines when used in combination with RCI: 【BODSOR・mBDSR】
Method and Case Studies (PDF) ★GogoJungle AWARD2020 winner★
https://www.gogojungle.co.jp/tools/indicators/11836
The PDF file includes 260 items.The material largely comprises examples that have been compiled to logically link higher and lower timeframes using three RCI lines, and finally wait for the timing to buy on the dips or sell on the rallies on the lower timeframe (= mBDSR signal).The explanations usemore than 1,000 charts.
× ![]()


