

GBP/JPY: Double bottom and a pullback buy signal from mBDSR
Indicator that shines in combination with RCI: BODSOR・mBDSR
Methods and Case Studies (PDF) ★GogoJungle AWARD2020 winner★
https://www.gogojungle.co.jp/tools/indicators/11836
260 PDF files are included.Many of them areexamples that break down how to logically link the higher and lower timeframes using 3 RCI lines, sequentially analyzing the conditions of multiple lower timeframes, and ultimately waiting for the timing to buy on dips or sell on rallies on the lower timeframe (the mBDSR signal).Explanation usesover 1,000 charts in total.are used.

In recent Investors Navi+ articles,we showcase examples that illustrate the strong synergy between various trading methods and mBDSR signalsto help you understand.
GBP/JPY 15-minute chart
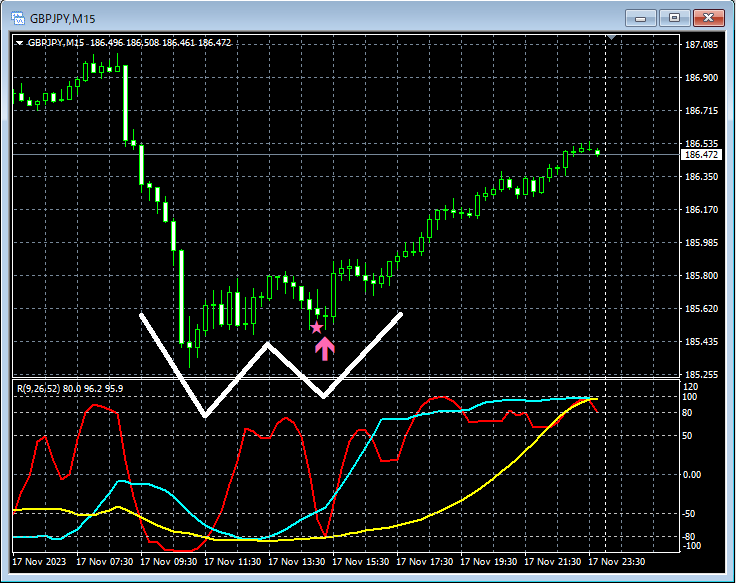
As a result,the pattern where the right side of a double top rises at the dipandthe Buy-the-Dip signal of mBDSR (filters: RCI26 and RCI52)lights up and rises.
From this example,you can see the high compatibility between a trade method focused on double bottomsandthe mBDSR signal.
Indicator that shines in combination with RCI: BODSOR・mBDSR
Methods and Case Studies (PDF) ★GogoJungle AWARD2020 winner★
https://www.gogojungle.co.jp/tools/indicators/11836
260 PDF files are included.Many of them areExamples that break down how to logically link the higher and lower timeframes using three RCI lines, sequentially examining multiple lower-timeframe conditions, and ultimately waiting for the timing to buy on dips or sell on rallies on the lower timeframe (the mBDSR signal).Explanation usesover 1,000 charts.
× ![]()


