

Neckline and mbDSR’s pullback buying signal and inverted head and shoulders
An indicator that shows its power in combination with RCI 【BODSOR・mBDSR】
and methods & case studies (PDF) ★GogoJungle AWARD 2020 recipient★
https://www.gogojungle.co.jp/tools/indicators/11836
260 PDF files are included.Many of them are about consolidating a form in which, by using three RCI lines to logically link higher and lower timeframes, multiple lower-timeframe conditions are sequentially examined, and finally waiting for a buy-on-dips or a sell-on-rallies timing on the lower timeframe (i.e., the mBDSR signal).In the description,more than 1,000 chartsare used.

In recent Investor Navi+ articles,we focus on examples that show the high compatibility between various trading methods and mBDSR signalsto help readers understand.
Euro/Australian dollar 1-hour chart
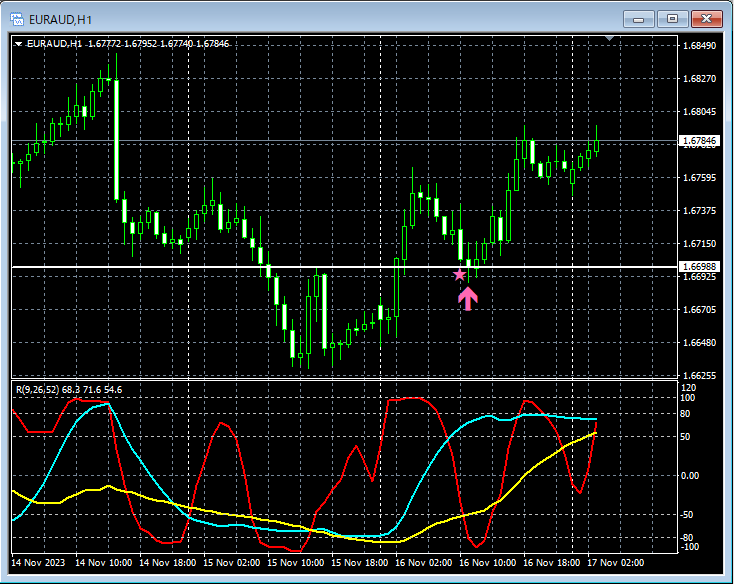
Necklinenearby,mBDSR (filter: RCI26 and RCI52) buy-on-dips signallights up. Then it rises.
Right shoulder of a head-and-shoulders patternalso appears to be a buy-on-dips signal.
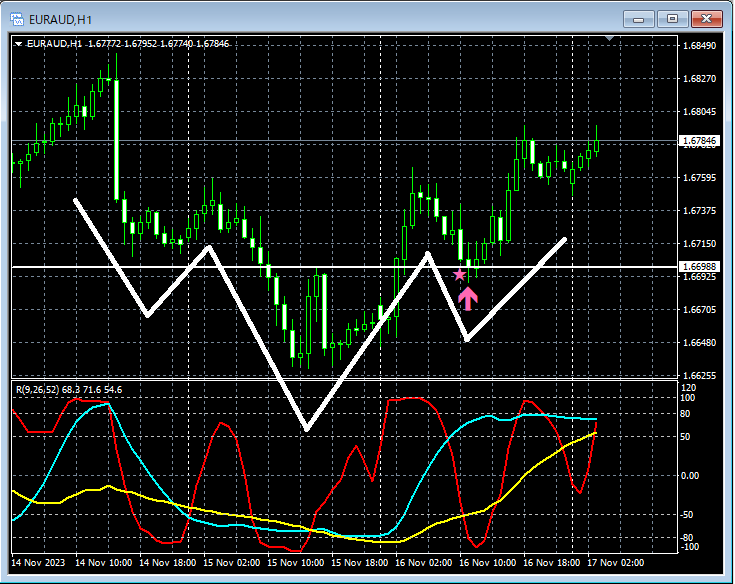
From this example,a trading method focusing on the necklineandhead-and-shouldersandmBDSR signalsshow a high degree of compatibility.
Indicator 【BODSOR・mBDSR】 that shines when used with RCI
and methods & case studies (PDF) ★GogoJungle AWARD 2020 recipient★
https://www.gogojungle.co.jp/tools/indicators/11836
260 PDF files are included.Many of them are about consolidating a form in which, by using three RCI lines to logically link higher and lower timeframes, multiple lower-timeframe conditions are sequentially examined, and finally waiting for a buy-on-dips or a sell-on-rallies timing on the lower timeframe (i.e., the mBDSR signal).In the description,more than 1,000 chartsare used.


