

Gold (XAUUSD): Daily EMA21 and 4-hour EMA21 and mBDSR pullback buying signal
Indicator that demonstrates power when combined with RCI【BODSOR・mBDSR】
and methods / case studies (PDF) ★GogoJungle AWARD2020 winner★
https://www.gogojungle.co.jp/tools/indicators/11836
260 PDF files are attached.Many of them are examples that lay out a process of logically linking higher and lower timeframes using three RCI lines to sequentially examine multiple lower timeframes, and finally wait for lower timeframe pullback buy or pullback sell signals (i.e., mBDSR signals).Description usesmore than 1,000 charts.

In recent Invest-navi+ articles,they focus on examples that show the high compatibility between various trading methods and mBDSR signalsto illustrate.
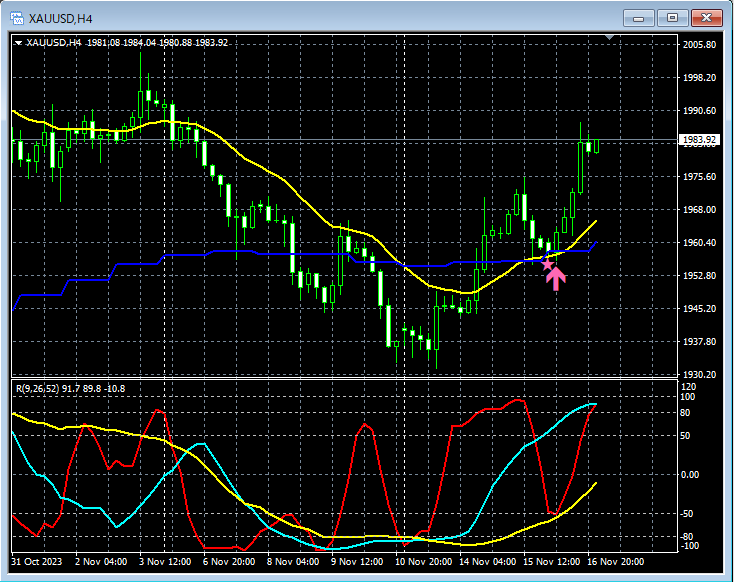
Gold (XAUUSD) 4-hour chart
Gold (XAUUSD) 15-minute chart
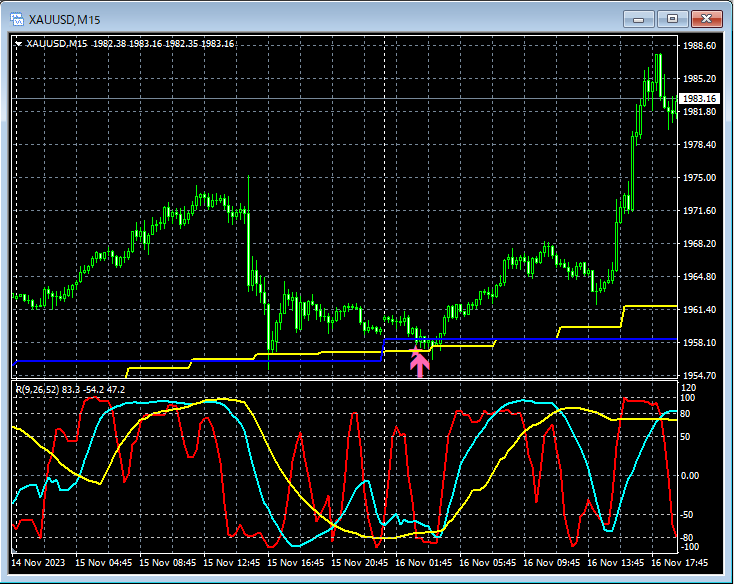
For both the 4-hour and 15-minute charts,the daily EMA21andthe 4-hour EMA21overlap aroundmBDSR (filters: RCI26 and RCI52) pullback buy signallights up and then rises.
From this example,the high compatibility between moving-average-focused trading methodsandmBDSR signalsis evident.
Indicator that shines when combined with RCI: 【BODSOR・mBDSR】
and methods / case studies (PDF) ★GogoJungle AWARD2020 winner★
https://www.gogojungle.co.jp/tools/indicators/11836
260 PDF files are attached.Many of them are examples that lay out a process of logically linking higher and lower timeframes using three RCI lines to sequentially examine multiple lower timeframes, and finally wait for lower timeframe pullback buy or pullback sell signals (i.e., mBDSR signals).Description usesmore than 1,000 charts.

× ![]()


