

Dollar-Yen: Buy signal on dips with RCI three-line, 1-hour EMA200, and mBDSR
Indicator that shines in combination with RCI: BODSOR・mBDSR
Methods and Case Studies (PDF) ★GogoJungle AWARD2020 Winner★
https://www.gogojungle.co.jp/tools/indicators/11836
The PDF file includes 250 items.Many of them are examples that lay out a form where multiple lower timeframes are logically linked using three RCI lines to sequentially examine the conditions of the higher and lower timeframes, ultimately waiting for a pullback buy or pullback sell timing on the lower timeframes (i.e., the mBDSR signal).The explanations usemore than 950 charts.are used.

In recent Investor Navigation+ articles,we focus on examples that demonstrate the high compatibility between various trading methods and the mBDSR signal..
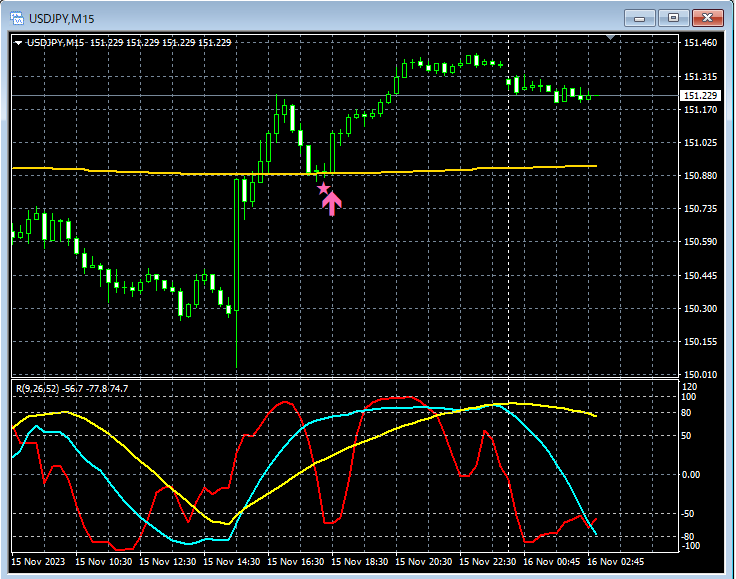
USD/JPY 15-minute chart
USD/JPY 1-minute chart
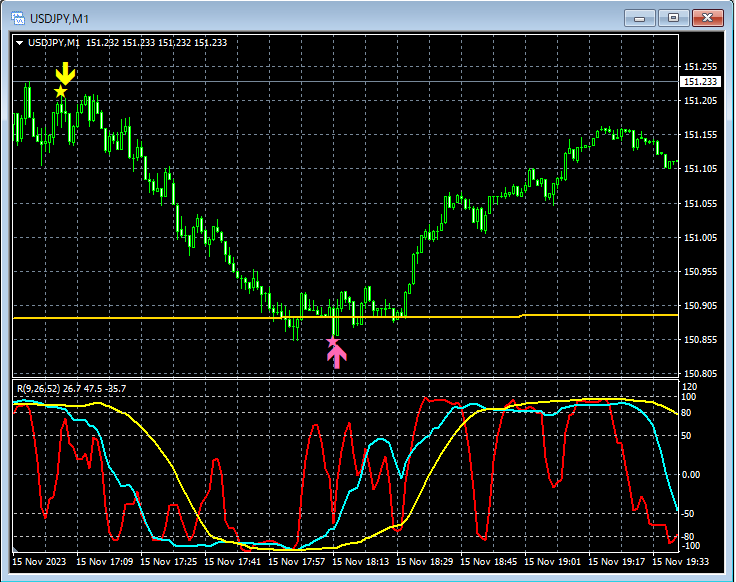
The higher timeframe context is omitted. For both the 5-minute and 1-minute timeframes,near the 200-period EMA on the 1-hour chartthemBDSR pullback buy signallights up (filter: RCI26 and RCI52). It then rises.
From this example,the high compatibility between moving average-based trading methodsandthe mBDSR signalis evident.
Indicator that shines in combination with RCI【BODSOR・mBDSR】
Methods and Case Studies (PDF) ★GogoJungle AWARD2020 Winner★
https://www.gogojungle.co.jp/tools/indicators/11836
The PDF file includes 250 items.Many of them are examples that lay out a form where multiple lower timeframes are logically linked using three RCI lines to sequentially examine the conditions of the higher and lower timeframes, ultimately waiting for a pullback buy or pullback sell timing on the lower timeframes (i.e., the mBDSR signal).The explanations usemore than 950 chartsare used.
× ![]()


