

Dollar/Yen: Fibonacci Retracement and mBDSR dip-buy signal
0
Indicator that showcases power when combined with RCI【BODSOR・mBDSR】
and methods & case studies (PDF) ★GogoJungle AWARD2020 Winner★
https://www.gogojungle.co.jp/tools/indicators/11836
The PDF file includes 250 items.Many of them are examples that have been distilled into a form where, by logically linking higher and lower timeframes using three RCI lines, the situations of multiple lower timeframes are sequentially analyzed, ultimately waiting for the timing to buy on dips or sell on rallies in the lower timeframe (i.e., mBDSR signals).This explanation usesover 950 charts in total.
In recent Investor Navi+ articles,we highlight examples that show the strong compatibility between various trading methods and mBDSR signals.
USD/JPY 4-hour chart
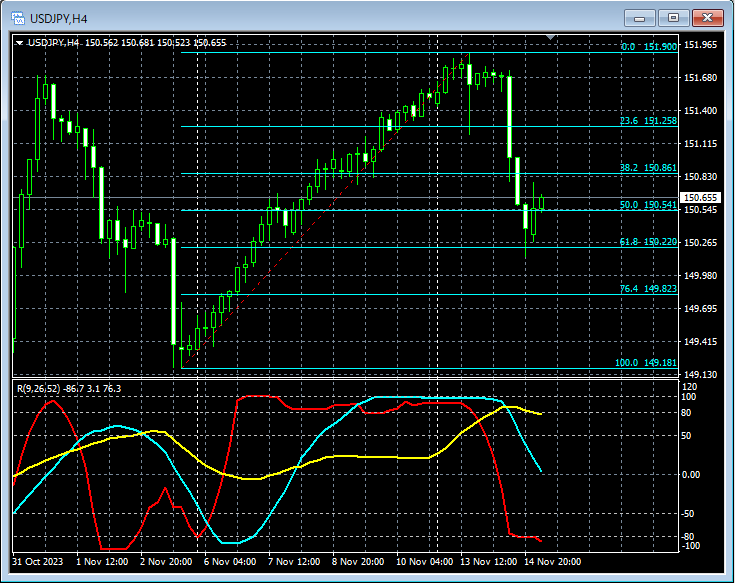
On the 4-hour chart,Fibonacci retracementpulls back to near 61.8%.
USD/JPY 5-minute chart
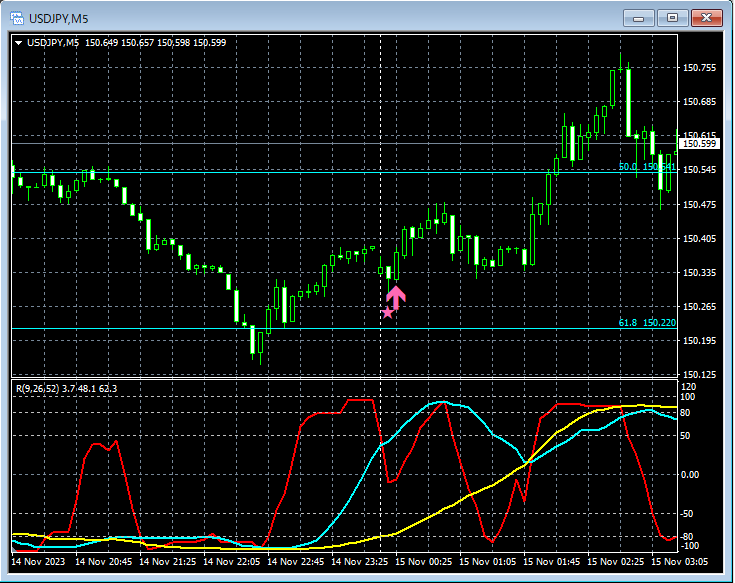
On the 5-minute chart,mBDSR (filter: RCI26 and RCI52) dip-buy signallights up, then rises.
From this example,the high compatibility between a trading method focused on Fibonacci retracementandmBDSR signalsis evident.
Indicator that shines when combined with RCI【BODSOR・mBDSR】
and methods & case studies (PDF) ★GogoJungle AWARD2020 Winner★
https://www.gogojungle.co.jp/tools/indicators/11836
The PDF file includes 250 items.Many of them are examples that have been distilled into a form where, by logically linking higher and lower timeframes using three RCI lines, the situations of multiple lower timeframes are sequentially analyzed, ultimately waiting for the timing to buy on dips or sell on rallies in the lower timeframe (i.e., mBDSR signals).This explanation usesover 950 charts in total.

× ![]()


