

Counter trend line and mBDSR signal
Indicator that shines when combined with RCI: BODSOR・mBDSR
Methods and Case Studies (PDF) ★GogoJungle AWARD2020 Winner★
https://www.gogojungle.co.jp/tools/indicators/11836
The PDF includes 250 files.Many of them are examples that describe using three RCI lines to logically link higher and lower timeframes, sequentially examining the conditions of multiple lower timeframes, and ultimately waiting for the timing to buy on dips or sell on rallies in the lower timeframe (the mBDSR signal).They usea total of 950+ charts in the explanations.

In recent Investor Navi+ articles,they focus on examples that illustrate the high compatibility between various trading methods and the mBDSR signalsto help readers understand.
Eurodollar 15-minute chart
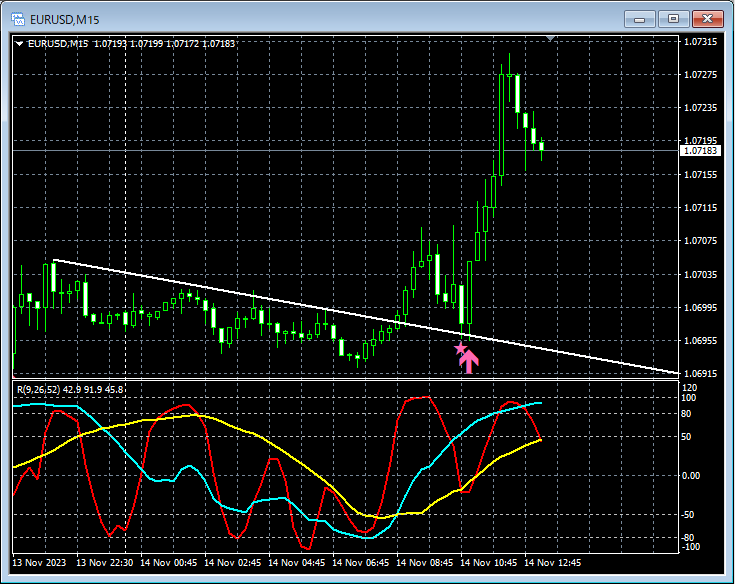
Counter-trend lineIn the subsequent decline after a breakout above,the mBDSR (RCI two-line filter) dip-buy signallights up, showing a common rising pattern.
From this example,you can see the high compatibility between the counter-trend line trading methodandthe mBDSR signals.
Indicator that shines when combined with RCI: BODSOR・mBDSR
Methods and Case Studies (PDF) ★GogoJungle AWARD2020 Winner★
https://www.gogojungle.co.jp/tools/indicators/11836
The PDF includes 250 files.Many of them are examples that describe using three RCI lines to logically link higher and lower timeframes, sequentially examining the conditions of multiple lower timeframes, and ultimately waiting for the timing to buy on dips or sell on rallies in the lower timeframe (the mBDSR signal).They usea total of 950+ charts in the explanations.

× ![]()


