

EMA200 and double bottom and mBDSR signal
0
An indicator that shines when combined with RCI: 【BODSOR・mBDSR】
and methods and case studies (PDF) ★GogoJungle AWARD2020 WINNER★
https://www.gogojungle.co.jp/tools/indicators/11836
The PDF comes with 250 files.Many of them areexamples that logically link higher and lower timeframes using three RCI lines, then progressively examine multiple lower-timeframe conditions, ultimately waiting for a pullback buy or a pullback sell timing on the lower timeframe (i.e., the mBDSR signal).This is how they are organized. The explanations usemore than 950 chartsin total.

In recent Investor Navi+ articles,they focus on examples that show the high compatibility between various trading methods and mBDSR signalsto illustrate this point.
EUR/USD 5-minute chart
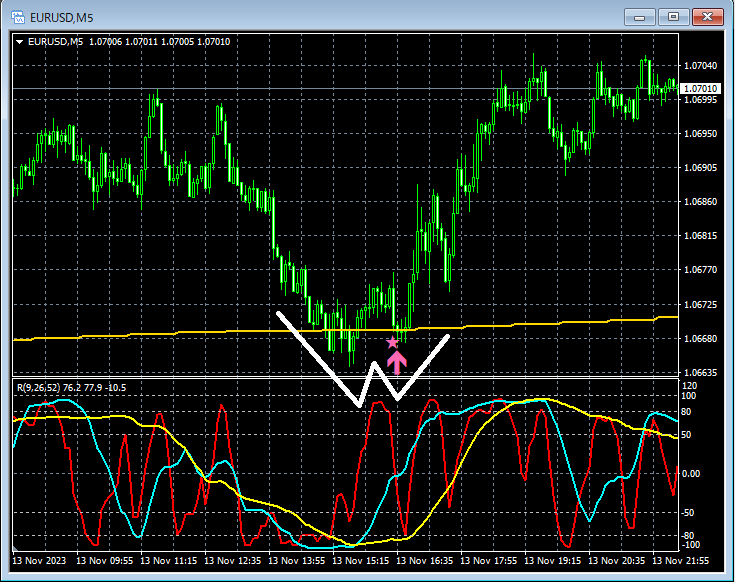
1-hour EMA200acts as support,forms a double bottomand rises.Double Bottomon the right-hand troughmBDSR (two RCI lines filter) pullback buy signallights up and prices rise, a common pattern.
From this example,a trading method focused on moving averagesandthe high compatibility between the Double BottomandmBDSR signalsbecomes apparent.
Also in this example,placing a stop-loss slightly below the recent lowandachieving a high risk-reward tradeis possible.
An indicator that shines when combined with RCI: 【BODSOR・mBDSR】
and methods and case studies (PDF) ★GogoJungle AWARD2020 WINNER★
https://www.gogojungle.co.jp/tools/indicators/11836
The PDF comes with 250 files.Many of them areexamples that logically link higher and lower timeframes using three RCI lines, then progressively examine multiple lower-timeframe conditions, ultimately waiting for a pullback buy or a pullback sell timing on the lower timeframe (i.e., the mBDSR signal).This is how they are organized. The explanations usemore than 950 chartsin total.
× ![]()


