

Elliott Wave, mBDSR, and R1R2S2 Signals on GBP/JPY 1-Hour Chart
0
Indicator that shows power when used in combination with RCI【BODSOR・mBDSR】
and method・case study (PDF) ★GogoJungle AWARD 2020 winner★
https://www.gogojungle.co.jp/tools/indicators/11836
The PDF file comes with 250 items.Many of them are examples that have been narrowed down to the form of waiting for timing to buy on pullbacks or sell on rallies in lower timeframes, by logically linking the higher and lower timeframes using three RCI lines (RCI3) and considering the multiple lower-timeframe conditions sequentially (i.e., the signals of mBDSR).The description usesmore than 950 charts. are used.

※【R1R2S2】 is included in the above product.
※ For detailed explanation of 【R1R2S2】here.
In recent Investor Navi+ articles,they focus on examples that show the high compatibility between various trading techniques and the signals of mBDSR and R1R2S2.
Pound/Yen 1-hour chart
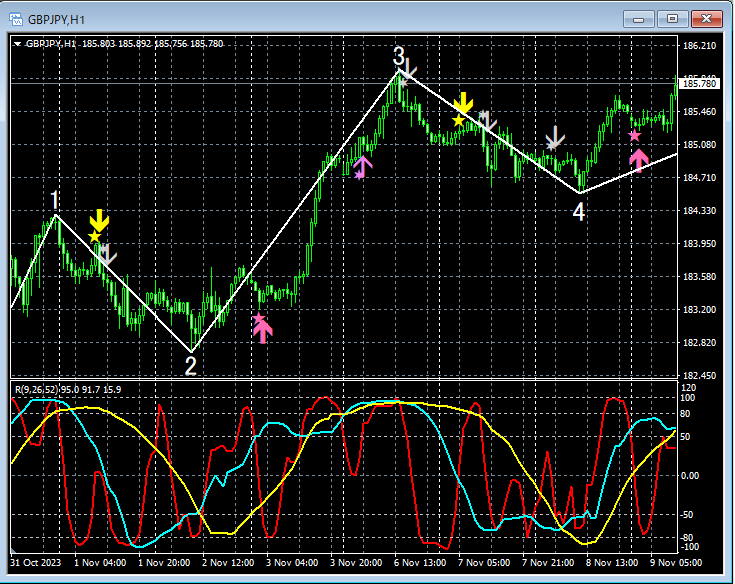
Elliott Wave
Wave 2:
mBDSR (RCI two-filter) sell signal lights up once
R1R2S2 sell signal lights up once
Wave 3:
mBDSR (RCI two-filter) buy-the-dip signal lights up once
R1R2S2 buy-the-dip signal lights up once
Wave 4:
mBDSR (RCI two-filter) sell signal lights up once
R1R2S2 sell signal lights up three times
Wave 5:
mBDSR (RCI two-filter) buy-the-dip signal lights up once
From this example,Elliott Waveandthe signals of mBDSRandR1R2S2signals show a high degree of harmony.
Indicator that shows power when used in combination with RCI【BODSOR・mBDSR】
and method・case study (PDF) ★GogoJungle AWARD 2020 winner★
https://www.gogojungle.co.jp/tools/indicators/11836
The PDF file comes with 250 items.Many of them are examples that have been narrowed down to the form of waiting for timing to buy on pullbacks or sell on rallies in lower timeframes, by logically linking the higher and lower timeframes using three RCI lines (RCI3) and considering the multiple lower-timeframe conditions sequentially (i.e., the signals of mBDSR).The description usesmore than 950 charts are used.
× ![]()


