

Sell signal on retracement: Pin Bar on the higher timeframe and R1 R2 S2 and mBDSR on the lower timeframe
0
Indicator that shines when used in combination with RCI: 【BODSOR・mBDSR】
Methods・Case studies (PDF) ★GogoJungle AWARD 2020 Winner★
https://www.gogojungle.co.jp/tools/indicators/11836
The PDF file includes 250 items.Many of them are examples that have been formulated to logically link higher timeframes and lower timeframes using three RCI lines, gradually examining multiple lower-timeframe conditions, and finally waiting for pullbacks in the lower timeframe (the mBDSR signals) to time entries for buying dips or selling rallies.In the explanations,more than 950 chartsare used.

※【R1R2S2】is included in the above product.
※ For detailed explanations on 【R1R2S2】,click here.
In recent Investment Navi+ articles,they focus on examples that illustrate the high compatibility between various trading methods and the signals of mBDSR and R1R2S2..
USDCAD 1-hour chart
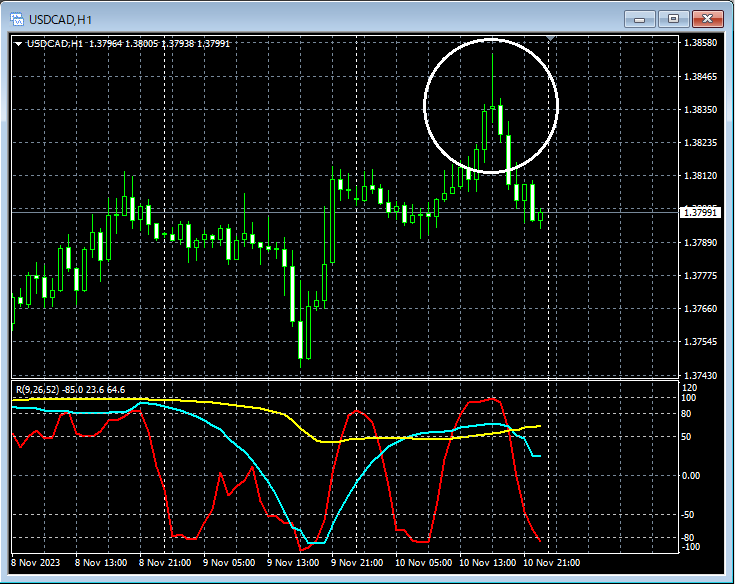
On the 1-hour chart,there is a candle with a long upper shadow indicating a potential decline (pin bar)appearing.
USDCAD 5-minute chart
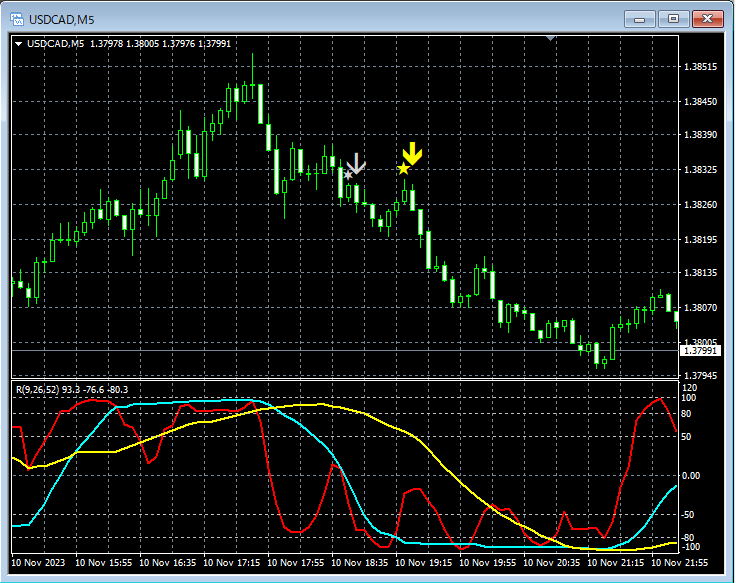
Subsequently, on the 5-minute chart,the return-sell signal of R1R2S2andthe return-sell signal of mBDSR (filters: RCI26 and RCI52)light up. The price falls further.
From this example,the high compatibility between a pin-bar-focused trading methodandthe signals of R1R2S2 and mBDSRis evident.
Indicator that shines in combination with RCI: 【BODSOR・mBDSR】
Methods・Case studies (PDF) ★GogoJungle AWARD 2020 Winner★
https://www.gogojungle.co.jp/tools/indicators/11836
The PDF file includes 250 items.Many of them are examples that have been formulated to logically link higher timeframes and lower timeframes using three RCI lines, gradually examining multiple lower-timeframe conditions, and finally waiting for pullbacks in the lower timeframe (the mBDSR signals) to time entries for buying dips or selling rallies.In the explanations,more than 950 chartsare used.

× ![]()


