

4-hour and 5-minute mbDSR pullback sell signal in the GBPUSD
Indicator that shines in combination with RCI: 【BODSOR・mBDSR】
and Methods & Case Studies (PDF) ★GogoJungle AWARD2020 Winner★
https://www.gogojungle.co.jp/tools/indicators/11836
The PDF file comes with 250 items.Most of them are examples that have been compiled to logically link higher and lower timeframes using the three RCI lines, examine the status of multiple lower timeframes sequentially, and finally wait for the timing to buy on dips or sell on rallies on the lower timeframe (i.e., the mBDSR signal).Explanation usesover 950 charts in total.

In recent Investor Navi+ articles,we focus on examples that show the high compatibility between various trading methods and the mBDSR signals..
GBPUSD 4-hour chart
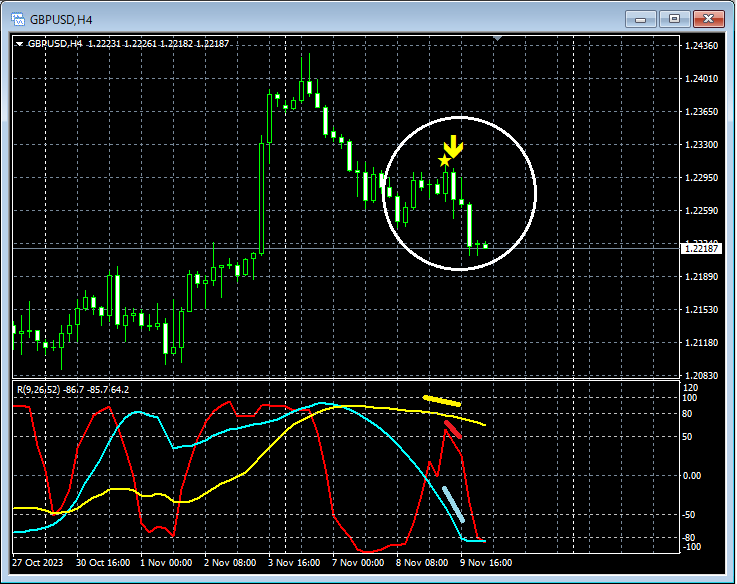
On the 4-hour chart,mBDSR (filter: RCI26 and RCI52) sell signallights up and pushes the price down.All three RCI lines declineto a very weak pattern.
GBPUSD 5-minute chart
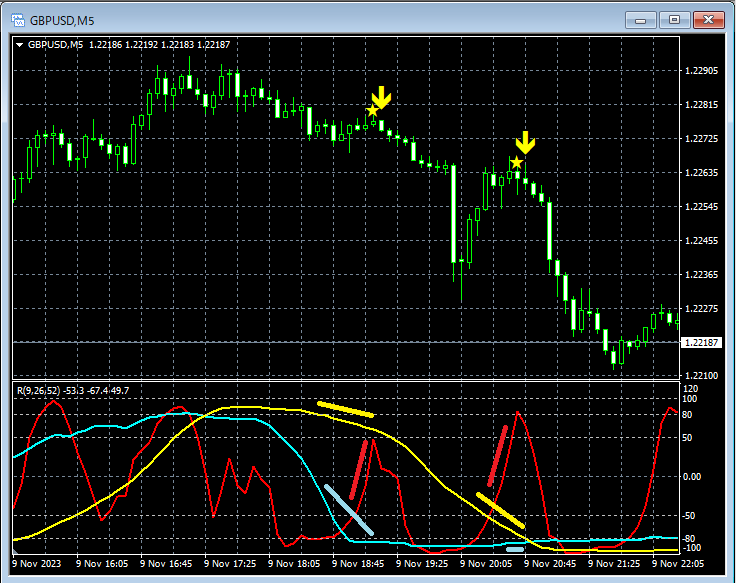
Subsequently, on the 5-minute chart,mBDSR (filter: RCI26 and RCI52) sell signallights up twice. The price continues lower.
From this example,we can see the strong compatibility between the RCI three-line method and the mBDSR signals.
Indicator that shines in combination with RCI: 【BODSOR・mBDSR】
and Methods & Case Studies (PDF) ★GogoJungle AWARD2020 Winner★
https://www.gogojungle.co.jp/tools/indicators/11836
The PDF file comes with 250 items.Most of them are examples that have been compiled to logically link higher and lower timeframes using the three RCI lines, examine the status of multiple lower timeframes sequentially, and finally wait for the timing to buy on dips or sell on rallies on the lower timeframe (i.e., the mBDSR signal).Explanation usesover 950 charts in total.
× ![]()


