

Translation (keeping HTML format, no markdown code blocks, single line): 4-hour EMA21 and mBDSR rebound sell signal
Indicator that shines in combination with RCI: 【BODSOR・mBDSR】
and Method & Case Study (PDF) ★GogoJungle AWARD2020 Winner★
https://www.gogojungle.co.jp/tools/indicators/11836
The PDF file comes with 250 items.Many of them explain the form of progressively examining multiple lower-timeframe conditions by logically linking higher and lower timeframes using three RCI lines, and ultimately waiting for a short-term buying on dips or selling on rallies in the lower timeframe (= mBDSR signal).Explanation usesover 950 charts.

In recent Investor Navigation+ articles,we focus on examples that show the high compatibility between various trading methods and mBDSR signalsto help you understand.
AUDUSD 5-minute chart
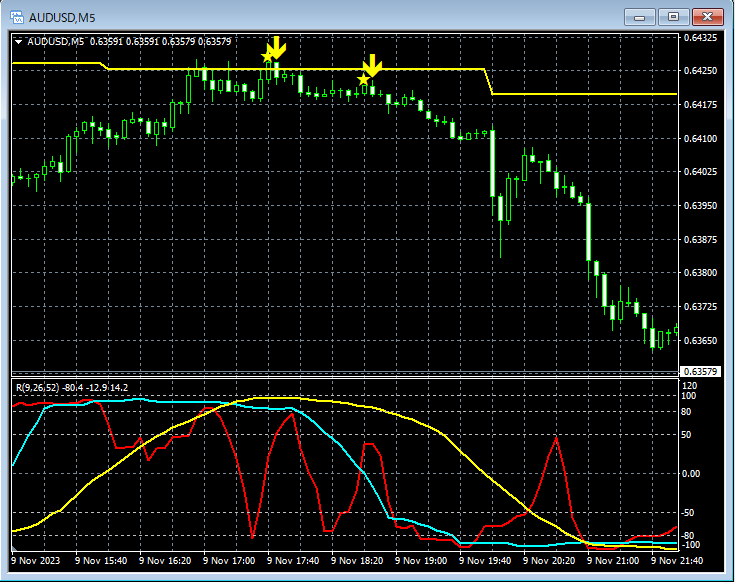
4-hour EMA21After a pullback near the area,mBDSR (filters: RCI26 and RCI52) pullback signallights up twice. Then it declines.
From this example,a trading approach focused on moving averagesandmBDSR signalsshows a strong compatibility.
Also, in this example,placing a stop-loss slightly above the recent highand so on,enables high risk-reward tradingopportunities.
Indicator that shines in combination with RCI: 【BODSOR・mBDSR】
https://www.gogojungle.co.jp/tools/indicators/11836
× ![]()


