

Sign of mBDSR on the EUR/USD weekly chart and Sign of R1R2S2
Indicator that delivers power in combination with RCI [BODSOR・mBDSR]
Methods and Case Studies (PDF) ★GogoJungle AWARD 2020 winner★
https://www.gogojungle.co.jp/tools/indicators/11836

※【R1R2S2】 is included in the product above.
※ For a detailed explanation of 【R1R2S2】here.
EURUSD Weekly
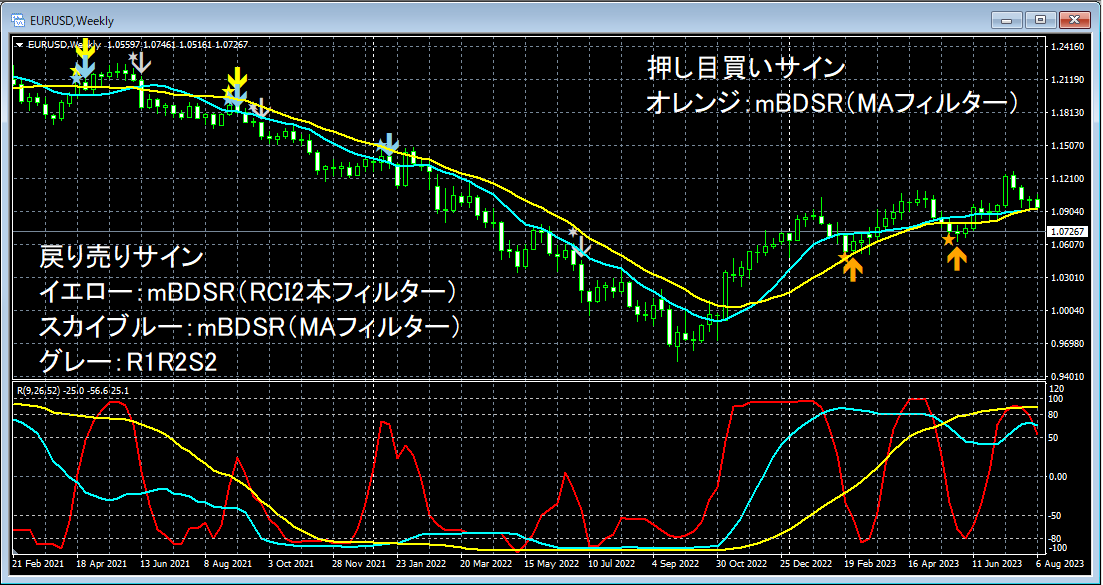
Within the range of the chart above, the following signals light up.
Pullback sell signals:
mBDSR (RCI two-filter) 2 times
mBDSR (MA filter) 3 times
R1R2S2 3 times
Dip-buy signals:
mBDSR (MA filter) 2 times
Indicator that delivers power in combination with RCI [BODSOR・mBDSR]
https://www.gogojungle.co.jp/tools/indicators/11836
A PDF file set with 250 files is included.Many of them aresummaries of examples where logical linking of upper and lower timeframes is done using three RCI lines, considering multiple lower-timeframe conditions in sequence, and ultimately waiting for timing of pullbacks or bounces on the lower timeframe (i.e., the mBDSR signals).The description usesmore than 950 charts in total..
× ![]()


