

USD/JPY after US employment report (Head-and-Shoulders, and R1 R2 S2 signals)
An indicator that demonstrates power in combination with RCI【BODSOR・mBDSR】
and methods/case studies (PDF) ★GogoJungle AWARD2020 winner★
https://www.gogojungle.co.jp/tools/indicators/11836

※【R1R2S2】is included in the above product.
※Detailed explanation about【R1R2S2】here。
In recent Investor Navigator+ articles,we mainly present examples that show the high compatibility between various trading methods and the signals of mBDSR and R1R2S2.
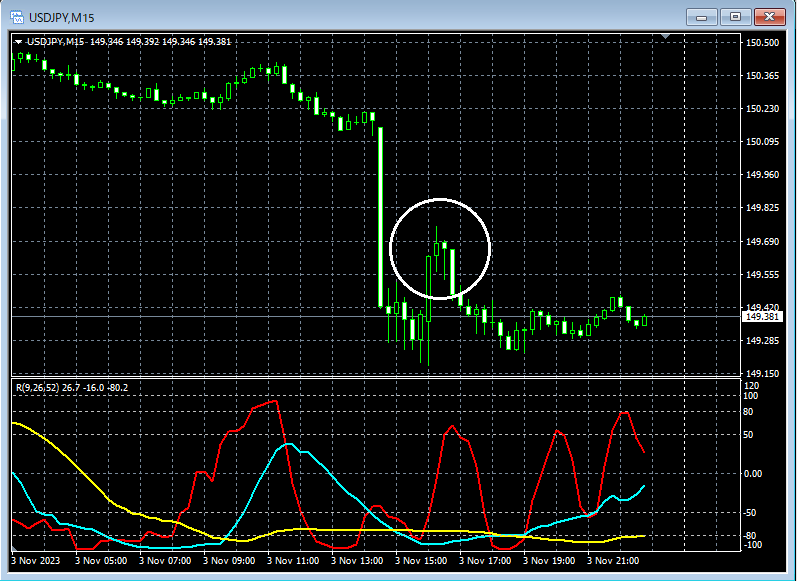
USD/JPY 15-minute chart
USD/JPY 1-minute chart
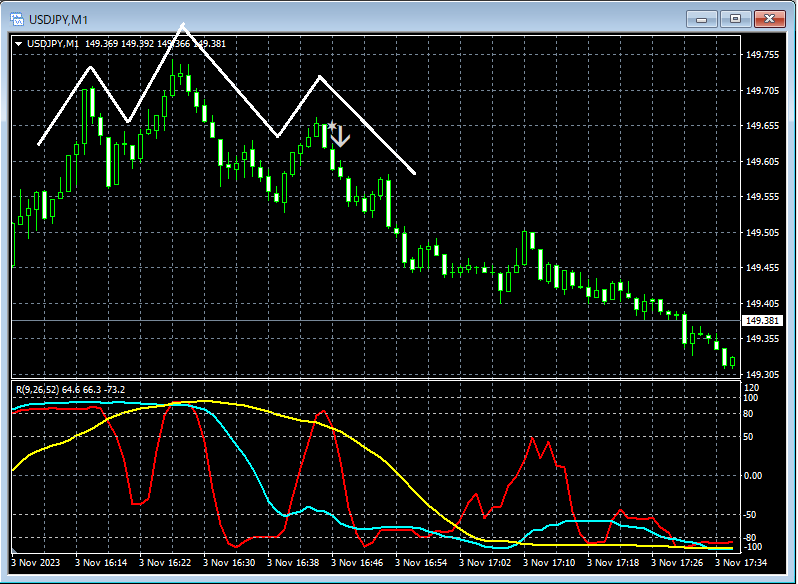
Focus on the rebound after the drop following the US employment statistics release. On the 1-minute chartHead and shouldersfrom which the decline occurred. As a result,the right shoulder of the head and shouldersshowsthe return sell signal of【R1R2S2】is lit up.
From this example,there is a strong compatibility between a trade method focusing on head and shouldersandthe signals of R1R2S2.
An indicator that shines in combination with RCI【BODSOR・mBDSR】
https://www.gogojungle.co.jp/tools/indicators/11836
250 PDF files are included.Most of them areexamples organized to logically link higher and lower timeframes using the three RCI lines, effectively analyzing the conditions of multiple lower timeframes and ultimately waiting for pullbacks in the lower timeframe (i.e., mBDSR signals) for entry.Explanation usesover 950 charts in total.
× ![]()


