

Moving average line, Head and shoulders, and R1R2S2 signals
An indicator that exerts its power when combined with RCI【BODSOR・mBDSR】
and methods and case studies (PDF) ★GogoJungle AWARD2020 winner★
https://www.gogojungle.co.jp/tools/indicators/11836

Note: 【R1R2S2】 is included in the above product.
For a detailed explanation of 【R1R2S2】here.
USDCAD 1-minute chart
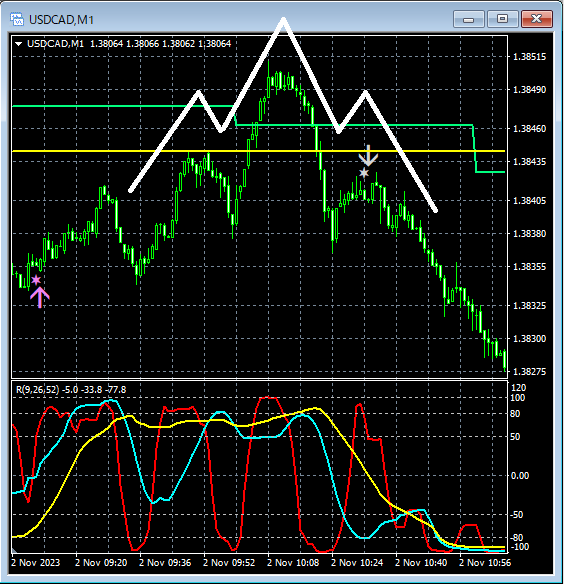
The status of higher timeframes is omitted.
On the 1-minute chartR1R2S2 buy-the-dollo (pullback) signalrises from the signal. Near EMA21 of the 4-hour chart and EMA21 of the 1-hour chart, a head-and-shoulders forms and declines. At the right shoulder of the head-and-shouldersR1R2S2 retracement sell signalis lit up.
An indicator that exerts its power when combined with RCI【BODSOR・mBDSR】
https://www.gogojungle.co.jp/tools/indicators/11836
A PDF file with 246 items is included.Most of them areexamples that detail how to logically link higher and lower timeframes using three RCI lines, and ultimately to wait for buy signals on pullbacks or sell signals on retracements on the lower timeframes (i.e., mBDSR signals)in which the descriptionutilizes more than 930 chartsin total.
× ![]()


