

Past notable lows and signs of mBDSR and signs of R1R2S2 (2023/11/02)
0
Indicator that proves its power in combination with RCI: 【BODSOR・mBDSR】
Methods and Case Studies (PDF) ★GogoJungle AWARD2020 Winner★
https://www.gogojungle.co.jp/tools/indicators/11836

Note: 【R1R2S2】is included in the above product.
For a detailed explanation of 【R1R2S2】here.
EUR/NZD 1-hour chart
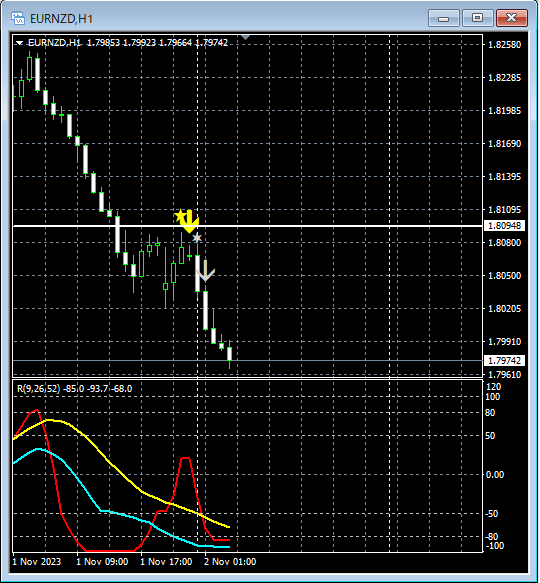
The status of higher timeframes is omitted. The horizontal line indicates a notable swing low on the 4-hour timeframe.
On the 1-hour chart, after breaking below the line that marks a past notable low, it then retraced near that same line,mBDSR (RCI two-filter) sell signal lit up and the price declined. Subsequently, a weak pattern of three RCI declines formed,the R1R2S2 sell signal also lit up. Further decline.
Indicator that proves its power in combination with RCI: 【BODSOR・mBDSR】
https://www.gogojungle.co.jp/tools/indicators/11836
A PDF file with 246 items is included.Most of them are examples that have been summarized to logically link the higher and lower timeframes using three RCI lines, sequentially examining the status of multiple lower timeframes and ultimately waiting for timing to buy on dips or sell on rallies on the lower timeframes (i.e., signals of mbDSR).The explanation uses over 930 charts in total..
× ![]()


