

Moving average line and mBDSR signal and R1R2S2 signal (2023/11/01)
Indicator that shines in combination with RCI【BODSOR・mBDSR】
Methods and Case Studies (PDF) ★GogoJungle AWARD2020 winner★
https://www.gogojungle.co.jp/tools/indicators/11836

※【R1R2S2】is included in the above product.
※ For details about【R1R2S2】here.
Swiss Franc / Yen 5-minute chart
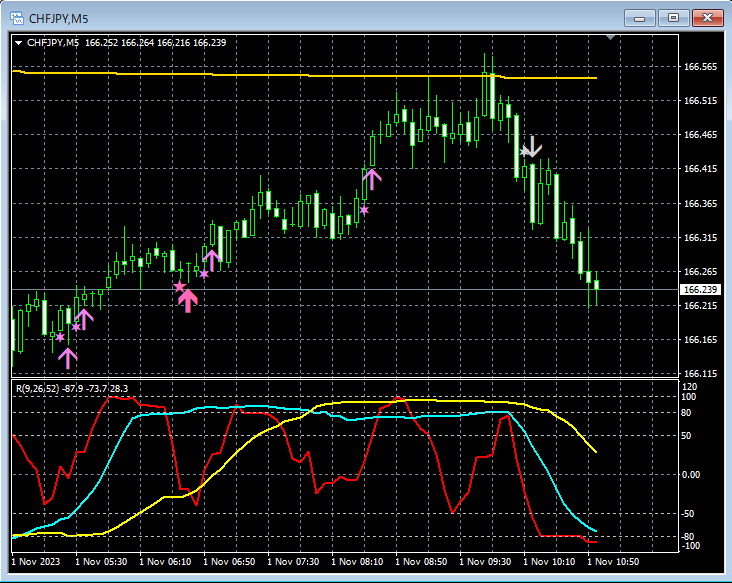
Price rose up near the EMA200 on the hourly chart. During that period, the mBDSR (RCI two-line filter) buy-the-dip signal lit up once, and the R1R2S2 buy-the-dip signal lit up four times.
Then it fell back from near the EMA200 on the hourly chart. After that, the R1R2S2 pullback-sell signal lit up once.
Indicator that shines in combination with RCI【BODSOR・mBDSR】
https://www.gogojungle.co.jp/tools/indicators/11836
A PDF file with 240 items is included.Many of them areexamples that break down situations on multiple lower timeframes by logically linking higher and lower timeframes using three RCI lines, ultimately waiting for the timing of pullbacks or recoveries on the lower timeframes (i.e., mBDSR signals).Descriptions includeover 900 charts used in the explanations..
× ![]()


