

Moving Average Line and mBDSR Sign and R1R2S2 Sign
0
An indicator that shines in combination with RCI: BODSOR・mBDSR
and methods / case studies (PDF) ★GogoJungle AWARD2020 winner★
https://www.gogojungle.co.jp/tools/indicators/11836

※【R1R2S2】 is included in the above product.
※ For detailed explanation about 【R1R2S2】here.
USD/JPY 5-minute chart
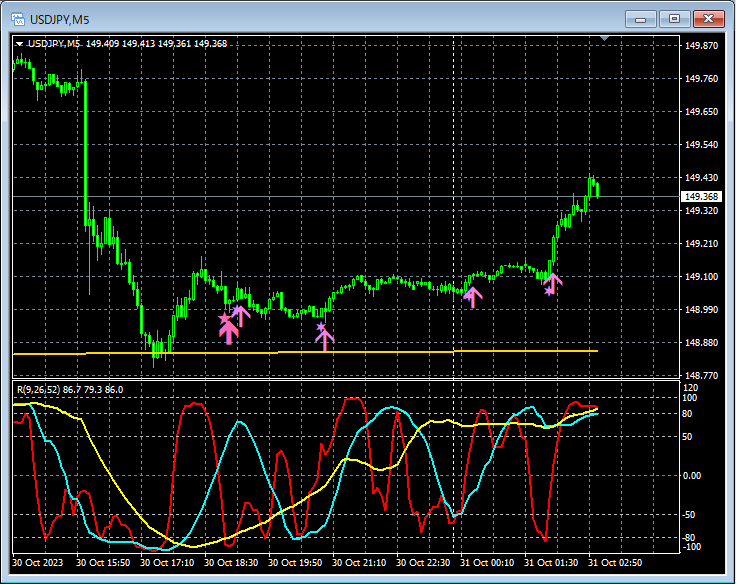
Rebound near EMA200 on the 4-hour chart. After mBDSR (RCI two-filter) pullback buy signal lights up, the R1R2S2 signals light up four times.
EUR/USD 5-minute chart
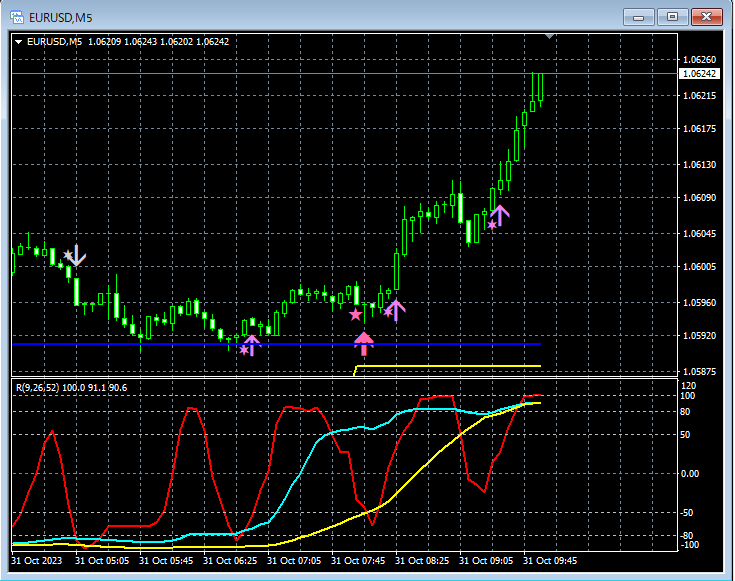
Rebound near the confluence of daily EMA21 and 4-hour EMA21. One pullback-buy signal from mBDSR (two-RCI filter) lights up. One pullback-sell signal from R1R2S2 lights up, three pullback-buy signals light up.
An indicator that shines in combination with RCI: BODSOR・mBDSR
https://www.gogojungle.co.jp/tools/indicators/11836
The PDF file comes with 240 items.Most of them are examples that logically link higher timeframes and lower timeframes using three RCI lines, and then break down the situation of multiple lower timeframes, finally waiting for the timing of pullbacks or pullback sells on the lower timeframes (i.e., signals of mBDSR).The explanation uses over 900 charts in total..
× ![]()


