

Counter trend line and sign of mBDSR and sign of R1 R2 S2
Indicator that powers up in combination with RCI【BODSOR・mBDSR】
with Method & Case Studies (PDF) ★GogoJungle AWARD2020 Winner★
https://www.gogojungle.co.jp/tools/indicators/11836

※【R1R2S2】is included in the above product.
※ For detailed explanation of【R1R2S2】here.
EUR/JPY 1-minute chart
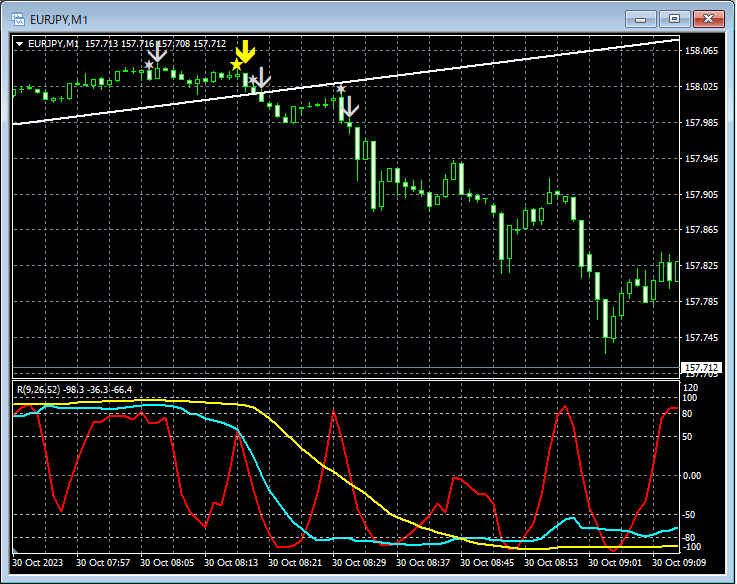
The status of the higher time frame is omitted.
In this example, around the counter-trend line, mBDSR (RCI two-line filter) signal has lit up once, and R1R2S2 signals have lit up three times.
Indicator that powers up in combination with RCI【BODSOR・mBDSR】
https://www.gogojungle.co.jp/tools/indicators/11836
A PDF file is included with 240 items.Most of them aresummaries that logically link the higher and lower time frames using three RCI lines, sequentially examining the conditions of multiple lower time frames, and ultimately waiting for timing to buy on dips or sell on rallies in the lower time frame (i.e., the mBDSR signals).The explanation usesover 900 charts..
× ![]()


