

RCI3 本「2段階判定」でトレンド転換・押し目買い・戻り売りを狙うインジケーター「R1R2S2」リリース!!
※This indicator is included with the product listed below.
Indicator that shines with power when used in combination with RCI【BODSOR・mBDSR】
and methodology/case studies (PDF) ★GogoJungle AWARD2020 winner★
https://www.gogojungle.co.jp/tools/indicators/11836
※If you have already purchased the above product, you can download again,“R1R2S2”is included in the downloaded file.
File name R1R2S2_XXXXXXXX.ex4
※This is an indicator without repaint.
MT4 Indicator【R1R2S2】
Three RCI lines and a two-stage decision for trend reversal, pullback buying, and retracement selling
Contents
【R1R2S2】Overview
【R1R2S2】Settings
Notes
● In【R1R2S2】, as a basic concept, when the short-term RCI breaks above (or below) a fixed level, if the three RCIs of short-term, mid-term, and long-term are all moving in the same direction (upwards for buy, downwards for sell), a buy (or sell) arrow sign lights up. Here,the two-stage判定 of being overbought/oversold for the short-term RCIis the major feature of this indicator.
For example, if you set the buy level (sell level) of the RCI to -80 (+80) and expect to buy (sell) when the RCI reaches this line and reverses, but it reverses before reaching -80 (+80) and you miss the opportunity,
to avoid such situations,the “Two-stage判定 of pullback and return using RCI”was devised.
The concept of the “Two-stage判定 of pullback and return using RCI”is as follows.
RCI Movement Diagram-1
① After breaking below the first buy level, if it does not reach the second buy level and breaks above the first buy level, a buy signal lights up.
② After breaking below the second buy level, it breaks above the second buy level, so a buy signal lights up.
RCI Movement Diagram-2
③ After breaking above the first sell level, if it does not reach the second sell level and breaks below the first sell level, a sell signal lights up.
④ After breaking above the second sell level, it breaks below the second sell level, so a sell signal lights up.
In【R1R2S2】, as shown below, you need to set three RCIs' periods (short-term, mid-term, long-term) and two lines for the short-term RCI overbought and two lines for oversold respectively.
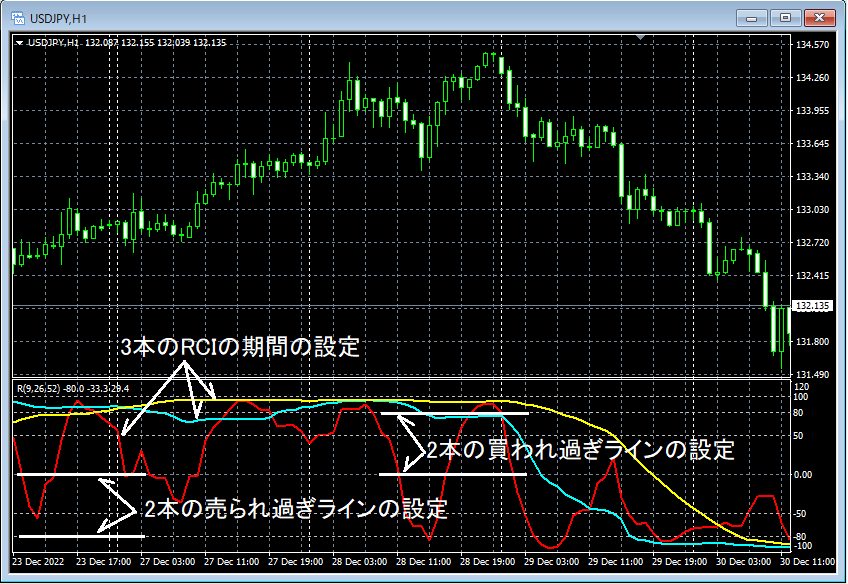
Example of signals for【R1R2S2】-1
OverboughtLevel1: 0, OverboughtLevel2: 80
OversoldLevel1: 0, OversoldLevel2: -80
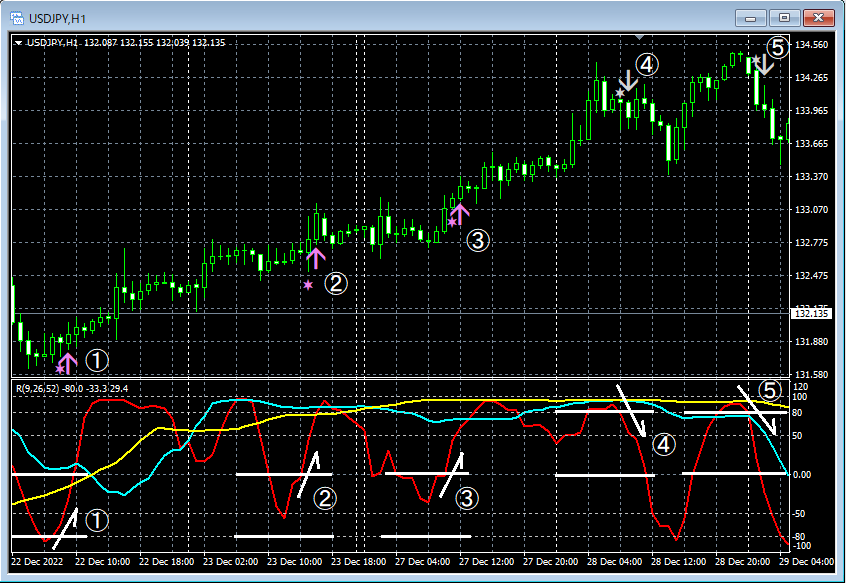
Main Window:R1R2S2 Signals
Sub Window: Short-term RCI, Mid-term RCI, Long-term RCI
①
The first oversold line (OversoldLevel1 = 0) is broken below, then the second oversold line (OversoldLevel2 = -80) is broken below. After that, when the second oversold line is broken above, both mid-term and long-term RCIs are moving up, so the signal lights up
②,③
The first oversold line (OversoldLevel1 = 0) is broken below, but the second oversold line (OversoldLevel2 = -80) is not broken below. After that, when the first oversold line is broken above, both mid-term and long-term RCIs are moving up, so the signal lights up
④,⑤
The first overbought line (OverboughtLevel1 = 0) is broken above, then the second overbought line (OverboughtLevel2 = 80) is broken above. After that, when the second overbought line is broken below, both mid-term and long-term RCIs are moving down, so the signal lights up
【R1R2S2】 Signals Example-2
OverboughtLevel1: 0, OverboughtLevel2: 80
OversoldLevel1: 0, OversoldLevel2: -80
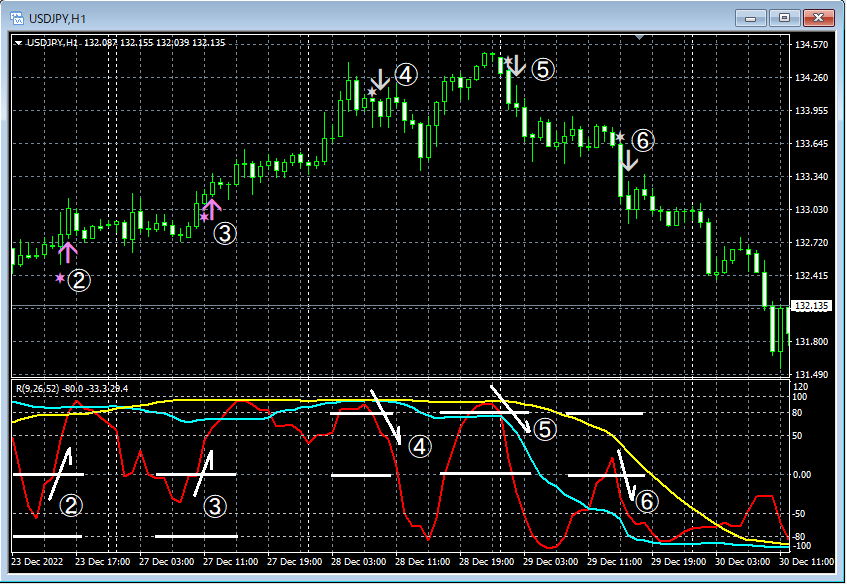
Main Window:R1R2S2 Signals
Sub Window: Short-term RCI, Mid-term RCI, Long-term RCI
②,③
The first oversold line (OversoldLevel1 = 0) is broken below, but the second oversold line (OversoldLevel2 = -80) is not broken below. After that, when the first oversold line is broken above, both mid-term and long-term RCIs are moving up, so the signal lights up
④,⑤
The first overbought line (OverboughtLevel1 = 0) is broken above, then the second overbought line (OverboughtLevel2 = 80) is broken above. After that, when the second overbought line is broken below, both mid-term and long-term RCIs are moving down, so the signal lights up
⑥
The first overbought line (OverboughtLevel1 = 0) is broken above, but the second overbought line (OverboughtLevel2 = 80) is not broken above. After that, when the first oversold line is broken below, both mid-term and long-term RCIs are moving down, so the signal lights up
※The above chart shows RCIs for explanation convenience, but note that【R1R2S2】 does not include an indicator that displays RCIs.
Back to contents
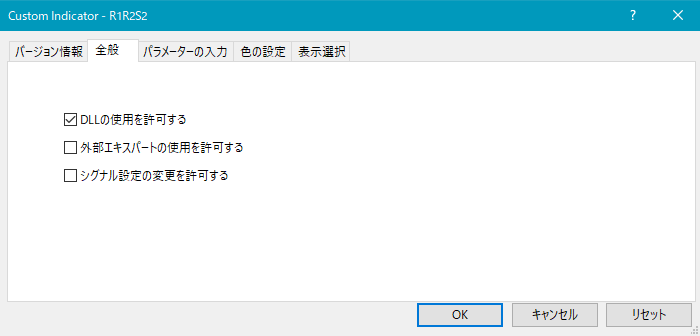
As shown below, you need to check “Allow DLL imports.”
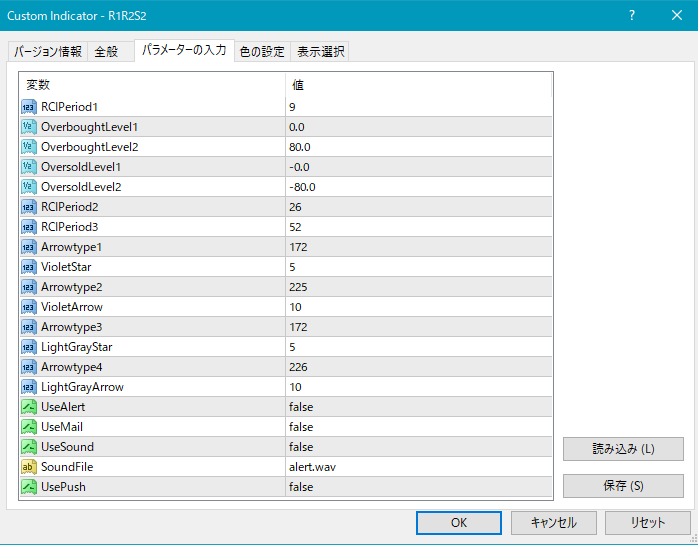
Settings for星印 and arrow appearance
RCIPeriod1: Short-term RCI period
OverboughtLevel1: First overbought line for RCI
OverboughtLevel2: Second overbought line for RCI
OversoldLevel1: First oversold line for RCI
OversoldLevel2: Second oversold line for RCI
RCIPeriod2: Mid-term RCI period
RCIPeriod3: Long-term RCI period
Settings for star/arrows display position
The display position of stars/arrows may be too close to the candlesticks or too far away, sometimes going off-screen. You can adjust the height to display these marks using the settings below. Larger values move the marks farther from the candlesticks.
Star mark (violet) → VioletStar
Arrow (violet) → VioletArrow
Star mark (light gray) → LightGrayStar
Arrow (light gray) → LightGrayArrow
Additionally, by changing the values below, you can modify the shape of the star and arrow marks.
(Default violet) Star mark → Arrowtype1
(Default violet) Arrow → Arrowtype2
(Default light gray) Star mark → Arrowtype3
(Default light gray) Arrow → Arrowtype4
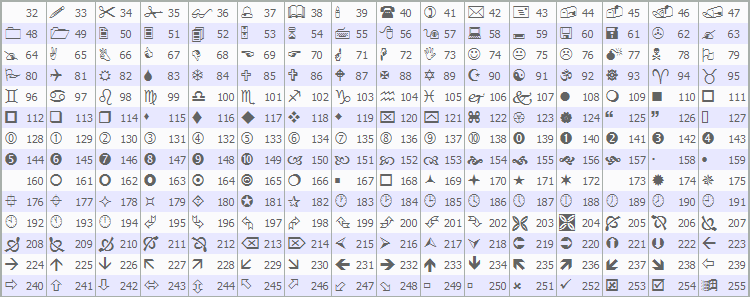
Also, the star marks or arrows or the symbols that can be used instead, and their corresponding numbers are listed in the table below.
For changes to star marks or arrows, please refer to the investor’s navigation article below.
https://www.gogojungle.co.jp/finance/navi/359/19177
Settings for alert notifications
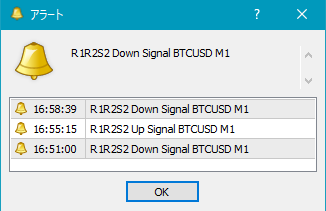
UseAlert:
If you want to be alerted by an alert dialog like the one below, select true; if not, select false.
UseMail:
If you want to be alerted by email, select true; if not, select false.
UseSound:
If you want to be alerted by a sound, select true; if not, select false.
SoundFile:
Enter the filename of the sound to use for alerts.
UsePush: Push notifications to alert signals
An example of MT4 side settings when using email alerts
Tool → Options → E-mail
Illustration
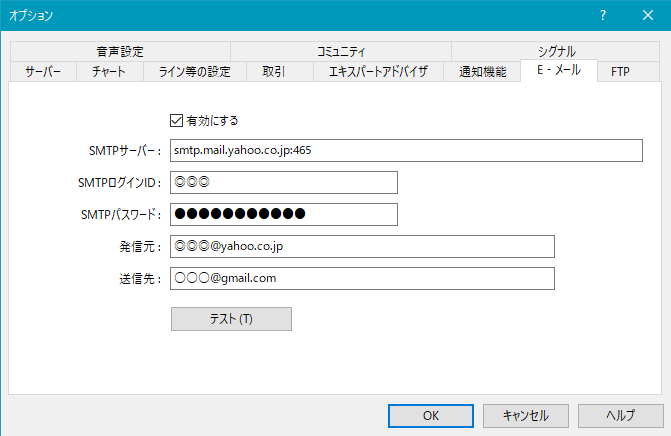
※It seems that MT4 needs to be restarted after settings.
Back to contents
※On this product overview page, for convenience of explanation, straight lines and arrows may be drawn, so please be aware of that.
Indicator that shines with power when used in combination with RCI【BODSOR・mBDSR】
and methodology/case studies (PDF) ★GogoJungle AWARD2020 winner★
https://www.gogojungle.co.jp/tools/indicators/11836
※If you have already purchased the above product, you can download again,“R1R2S2”is included in the downloaded file.
File name R1R2S2_XXXXXXXX.ex4
※This is an indicator without repaint.
MT4 Indicator【R1R2S2】
Three RCI lines and a two-stage decision for trend reversal, pullback buying, and retracement selling
Contents
【R1R2S2】Overview
【R1R2S2】Settings
Notes
◆【R1R2S2】 Overview
● In【R1R2S2】, as a basic concept, when the short-term RCI breaks above (or below) a fixed level, if the three RCIs of short-term, mid-term, and long-term are all moving in the same direction (upwards for buy, downwards for sell), a buy (or sell) arrow sign lights up. Here,the two-stage判定 of being overbought/oversold for the short-term RCIis the major feature of this indicator.
For example, if you set the buy level (sell level) of the RCI to -80 (+80) and expect to buy (sell) when the RCI reaches this line and reverses, but it reverses before reaching -80 (+80) and you miss the opportunity,
to avoid such situations,the “Two-stage判定 of pullback and return using RCI”was devised.
The concept of the “Two-stage判定 of pullback and return using RCI”is as follows.
RCI Movement Diagram-1
① After breaking below the first buy level, if it does not reach the second buy level and breaks above the first buy level, a buy signal lights up.
② After breaking below the second buy level, it breaks above the second buy level, so a buy signal lights up.
RCI Movement Diagram-2
③ After breaking above the first sell level, if it does not reach the second sell level and breaks below the first sell level, a sell signal lights up.
④ After breaking above the second sell level, it breaks below the second sell level, so a sell signal lights up.
In【R1R2S2】, as shown below, you need to set three RCIs' periods (short-term, mid-term, long-term) and two lines for the short-term RCI overbought and two lines for oversold respectively.
Example of signals for【R1R2S2】-1
OverboughtLevel1: 0, OverboughtLevel2: 80
OversoldLevel1: 0, OversoldLevel2: -80
Main Window:R1R2S2 Signals
Sub Window: Short-term RCI, Mid-term RCI, Long-term RCI
①
The first oversold line (OversoldLevel1 = 0) is broken below, then the second oversold line (OversoldLevel2 = -80) is broken below. After that, when the second oversold line is broken above, both mid-term and long-term RCIs are moving up, so the signal lights up
②,③
The first oversold line (OversoldLevel1 = 0) is broken below, but the second oversold line (OversoldLevel2 = -80) is not broken below. After that, when the first oversold line is broken above, both mid-term and long-term RCIs are moving up, so the signal lights up
④,⑤
The first overbought line (OverboughtLevel1 = 0) is broken above, then the second overbought line (OverboughtLevel2 = 80) is broken above. After that, when the second overbought line is broken below, both mid-term and long-term RCIs are moving down, so the signal lights up
【R1R2S2】 Signals Example-2
OverboughtLevel1: 0, OverboughtLevel2: 80
OversoldLevel1: 0, OversoldLevel2: -80
Main Window:R1R2S2 Signals
Sub Window: Short-term RCI, Mid-term RCI, Long-term RCI
②,③
The first oversold line (OversoldLevel1 = 0) is broken below, but the second oversold line (OversoldLevel2 = -80) is not broken below. After that, when the first oversold line is broken above, both mid-term and long-term RCIs are moving up, so the signal lights up
④,⑤
The first overbought line (OverboughtLevel1 = 0) is broken above, then the second overbought line (OverboughtLevel2 = 80) is broken above. After that, when the second overbought line is broken below, both mid-term and long-term RCIs are moving down, so the signal lights up
⑥
The first overbought line (OverboughtLevel1 = 0) is broken above, but the second overbought line (OverboughtLevel2 = 80) is not broken above. After that, when the first oversold line is broken below, both mid-term and long-term RCIs are moving down, so the signal lights up
※The above chart shows RCIs for explanation convenience, but note that【R1R2S2】 does not include an indicator that displays RCIs.
Back to contents
◆【R1R2S2】Settings
As shown below, you need to check “Allow DLL imports.”
Settings for星印 and arrow appearance
RCIPeriod1: Short-term RCI period
OverboughtLevel1: First overbought line for RCI
OverboughtLevel2: Second overbought line for RCI
OversoldLevel1: First oversold line for RCI
OversoldLevel2: Second oversold line for RCI
RCIPeriod2: Mid-term RCI period
RCIPeriod3: Long-term RCI period
Settings for star/arrows display position
The display position of stars/arrows may be too close to the candlesticks or too far away, sometimes going off-screen. You can adjust the height to display these marks using the settings below. Larger values move the marks farther from the candlesticks.
Star mark (violet) → VioletStar
Arrow (violet) → VioletArrow
Star mark (light gray) → LightGrayStar
Arrow (light gray) → LightGrayArrow
Additionally, by changing the values below, you can modify the shape of the star and arrow marks.
(Default violet) Star mark → Arrowtype1
(Default violet) Arrow → Arrowtype2
(Default light gray) Star mark → Arrowtype3
(Default light gray) Arrow → Arrowtype4
Also, the star marks or arrows or the symbols that can be used instead, and their corresponding numbers are listed in the table below.
For changes to star marks or arrows, please refer to the investor’s navigation article below.
https://www.gogojungle.co.jp/finance/navi/359/19177
Settings for alert notifications
UseAlert:
If you want to be alerted by an alert dialog like the one below, select true; if not, select false.
UseMail:
If you want to be alerted by email, select true; if not, select false.
UseSound:
If you want to be alerted by a sound, select true; if not, select false.
SoundFile:
Enter the filename of the sound to use for alerts.
UsePush: Push notifications to alert signals
An example of MT4 side settings when using email alerts
Tool → Options → E-mail
Illustration
※It seems that MT4 needs to be restarted after settings.
Back to contents
◆Notes
※On this product overview page, for convenience of explanation, straight lines and arrows may be drawn, so please be aware of that.
× ![]()


