

Past prominent lows, moving averages, counter-trend lines, and mBDSR signals
0
Indicator that shines when combined with RCI: BODSOR and mBDSR
Methods and Case Studies (PDF) ★GogoJungle AWARD2020 winner★
https://www.gogojungle.co.jp/tools/indicators/11836

In recent Investor Navigator+ articles,we focus on examples that show the strong compatibility between various trading methods and the mBDSR signals.
Euro/Swiss Daily
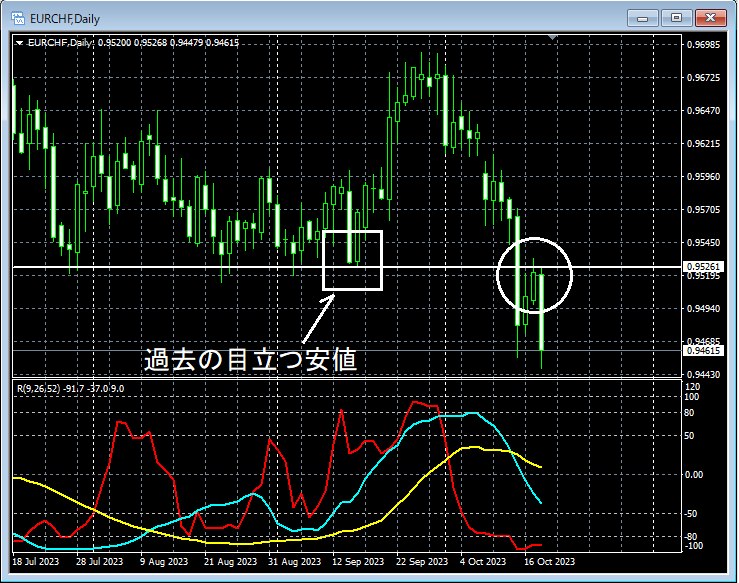
We will pay attention to the area circled in white on the above daily chart.A line indicating notable past lowsis broken, then it rises again toward near this line. We will look at this movement on the 1-hour chart.
Euro/Swiss 1-Hour
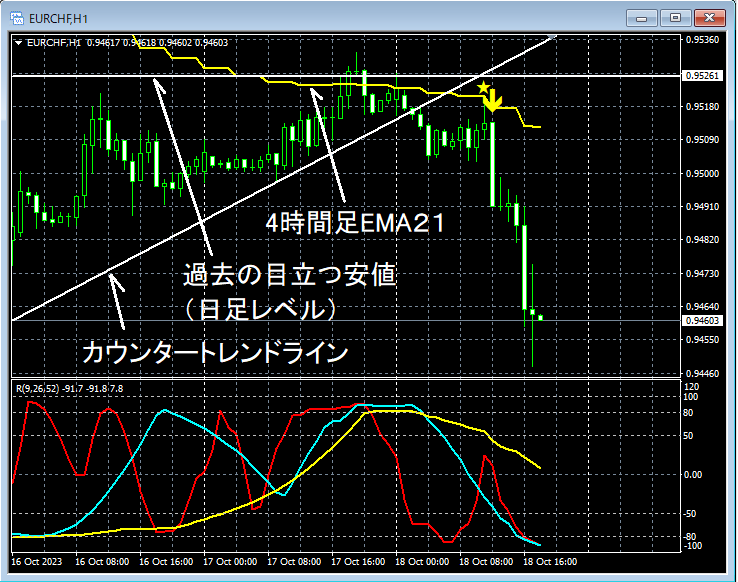
On the above 1-hour chart,the mBDSR (RCI two-filter) pullback sell signallights up, and price has been steadily falling immediately afterward.
Also,near notable past lowswe see a rebound, followed by furthercounter-trend linebreakdown,and when it returns near the 4-hour EMA21the pullback sell signal also lights up.
In the above example,the mBDSR pullback sell signallights up at severalpoints where entry rationale overlaps, I would say.
From this example,the high compatibility between trading methods that focus on past notable lows, counter-trend lines, and moving averagesandmBDSR signalsis evident.
Indicator that shines when combined with RCI: BODSOR and mBDSR
https://www.gogojungle.co.jp/tools/indicators/11836
PDF files are included: 220 in total.Most of them are composed to illustrate a process: using three RCI lines to logically link higher and lower timeframes, sequentially considering the status of multiple lower timeframes, and ultimately waiting for pullbacks or pullback buy signals (i.e., mBDSR signals) on the lower timeframes. The explanations usemore than 830 charts in total.andthese charts are used..
× ![]()


