

Supportive price (Dow Theory) and notable past highs, counter-trend line, Fibonacci retracement, and mBDSR signals
0
Indicator that shines in combination with RCI【BODSOR・mBDSR】
Methods and Case Studies (PDF) ★GogoJungle AWARD2020 Winner★
https://www.gogojungle.co.jp/tools/indicators/11836
A PDF file with 283 attachments is included.
Many of them are summaries of examples that break down how to logically link higher and lower timeframes using 3 RCI lines, sequentially analyze the conditions of multiple lower timeframes, and finally wait for the timing of a pullback buying or pullback selling on the lower timeframe (the mBDSR signal)..
Also,many focus on identifying points where multiple entry justifications overlap.
In the explanationsmore than 1,000 chartswere used.

In a recent Invest-Navi+ article,examples centered around the high compatibility between various trading methods and the mBDSR signalare introduced.
GBPJPY 4-hour chart
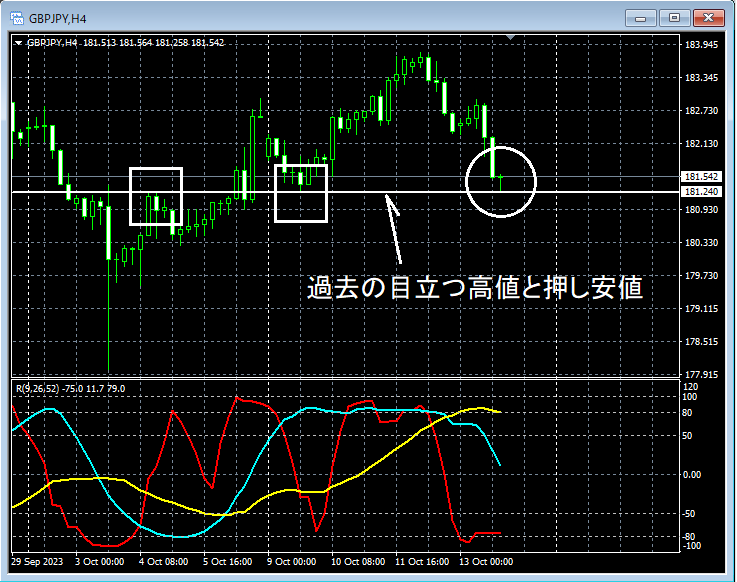
We will focus on the area circled in white above on the 4-hour chart.Past notable highsandpullback lowshave converged, so we will examine the movement around this area on the 5-minute and 1-minute charts.
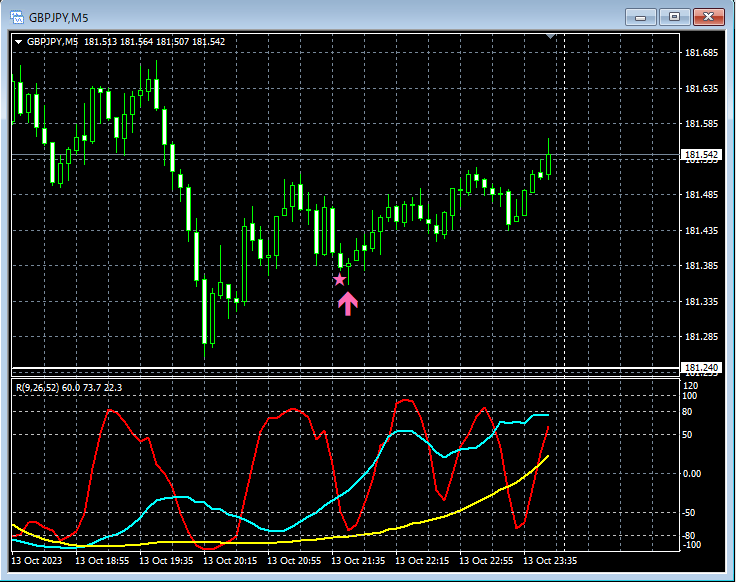
GBPJPY 5-minute chart
GBPJPY 1-minute chart
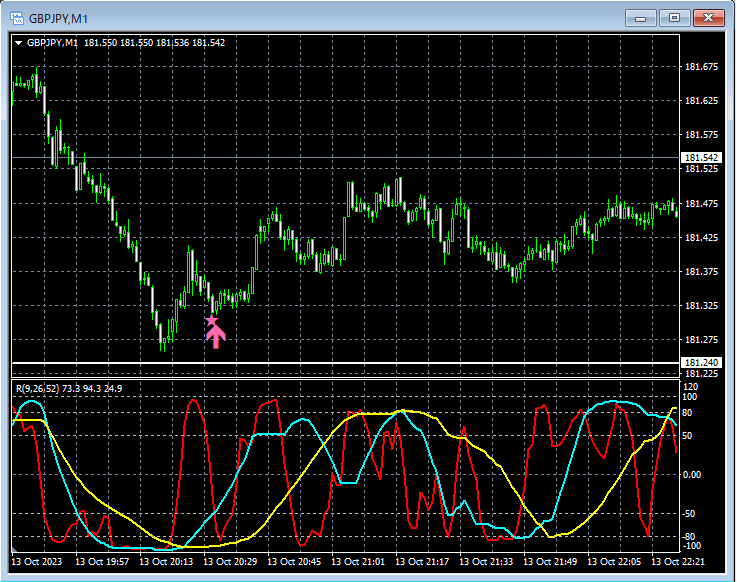
On both the 5-minute and 1-minute charts,the mBDSR (RCI two-filter) pullback buying signallights up, and the price rises smoothly right after (the signal on the 1-minute chart occurs earlier than on the 5-minute).
On the 1-minute chart, as shown below,Counter-trend lineis breached, and the pullback buying signallights upon the pullback.
GBPJPY 1-minute chart
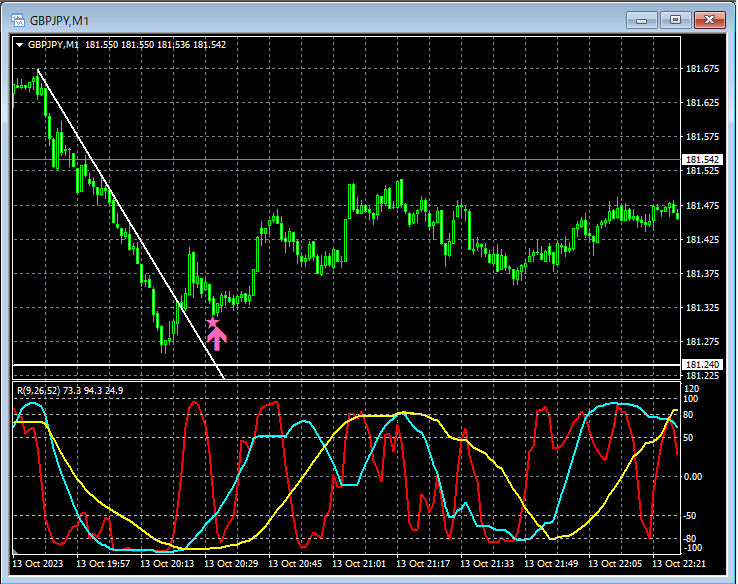
Furthermore,Counter-trend linebreach followed by a high,Fibonacci retracement 61.8% pullbackoccurs,pullback buying signallights up as well.
GBPJPY 1-minute chart
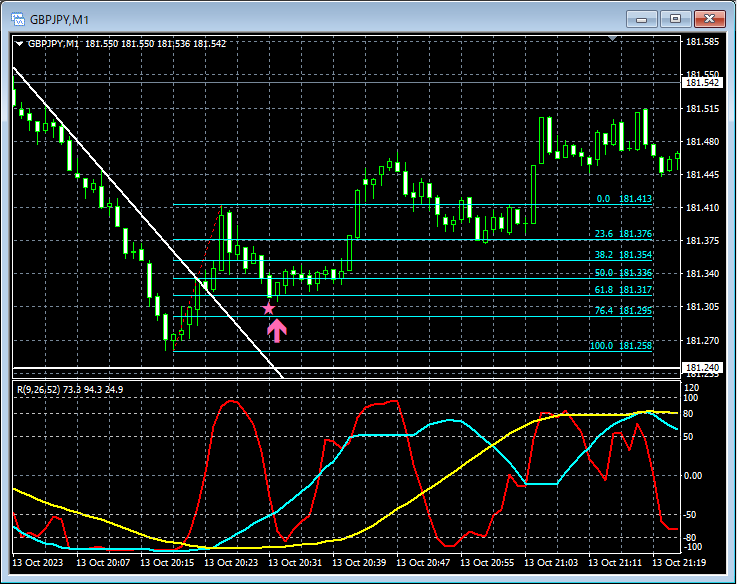
From this example,a high degree of compatibility is evident between Dow Theory, counter-trend lines, Fibonacci retracement, and past notable highs trading methodsandthe mBDSR signal.
Indicator that shines in combination with RCI【BODSOR・mBDSR】
Methods and Case Studies (PDF) ★GogoJungle AWARD2020 Winner★
https://www.gogojungle.co.jp/tools/indicators/11836
A PDF file with 283 attachments is included.
Many of them are summaries of examples that break down how to logically link higher and lower timeframes using 3 RCI lines, sequentially analyze the conditions of multiple lower timeframes, and finally wait for the timing of a pullback buying or pullback selling on the lower timeframe (the mBDSR signal)..
Also,many focus on identifying points where multiple entry justifications overlap.
In the explanationsmore than 1,000 chartswere used.
× ![]()


