

Elliott Wave, three-line RCI, notable weekly-level lows, double top, and mBDSR signals
Indicator that shines in combination with RCI【BODSOR・mBDSR】
https://www.gogojungle.co.jp/tools/indicators/11836

In recent Investor Navigator+ articles,we introduce examples focusing on the high compatibility between various trading methods and mBDSR signalsso you can understand.
GBPUSD Weekly
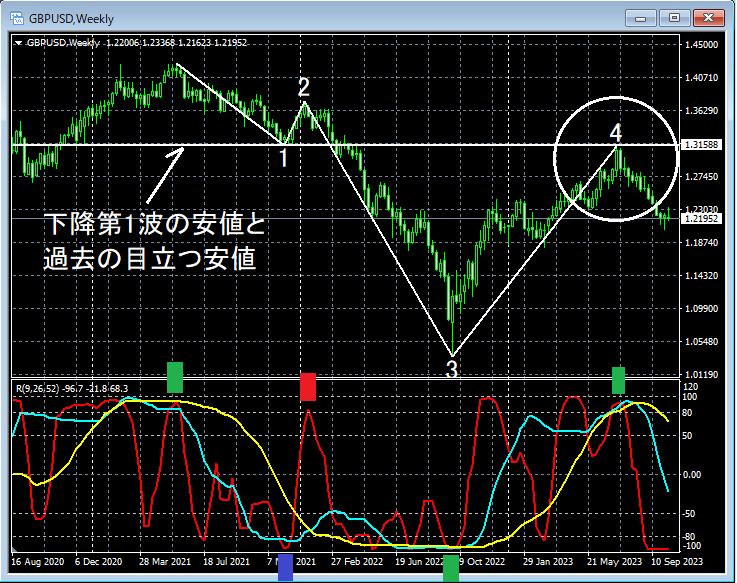
First, on the weekly chart above,Elliott WaveandRCI 3-linerelationship to examine.
RCI three-in-a-row top (green rectangle) rises: Wave 1 begins
RCI double bottom (blue rectangle) falls: Wave 1 ends, Wave 2 begins
RCI 9 rises to the topping zone (red rectangle): Wave 2 ends, Wave 3 begins
RCI triple bottom (green rectangle) falls: Wave 3 ends, Wave 4 begins
RCI triple top (green rectangle) rises: Wave 4 ends
From the above,Elliott WaveandBehavior of the 3 RCI linesare closely related.
Looking around the white circled area, it often serves as resistance“a line indicating notable past lows”This movement can be seen rising toward that vicinity. We will examine this area on the 4-hour chart.
GBPUSD 4-hour
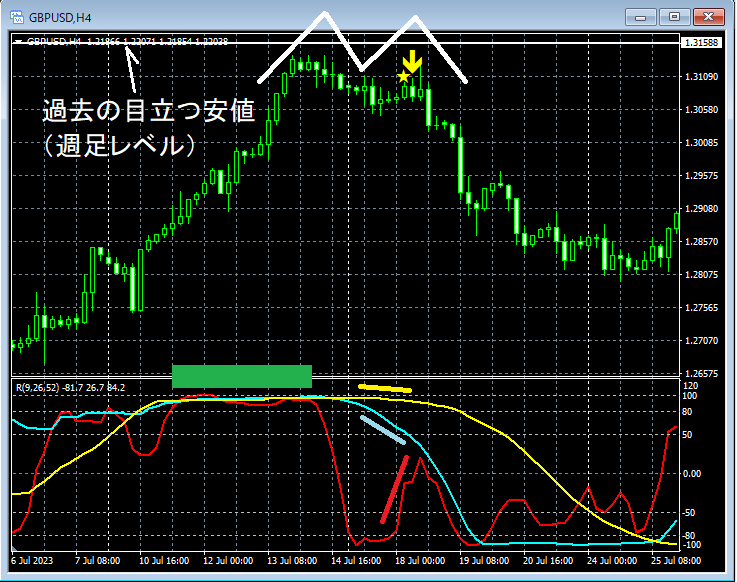
In the 4-hour chart above,mBDSR (two RCI filters) short selling signallights up, and price subsequently declines smoothly.Double topformation and decline are also noteworthy.
Double topOn the right peak,mBDSR (filters: RCI26 and RCI52) short selling signallights up and price falls — considered an important pattern.
From this example,Elliott WaveandDouble TopandNotable past lowsare combined with trading methods that focus on theRCI 3-lineandmBDSR signalsto show a high degree of compatibility.
Also in this example,placing a stop-loss just above the recent highallows forhigh reward-to-risk tradesto be possible.
Indicator that shines in combination with RCI【BODSOR・mBDSR】
https://www.gogojungle.co.jp/tools/indicators/11836
A PDF file with 204 items is included.Most of them summarize cases where a logical link is drawn between higher and lower timeframes using the RCI 3-line, progressively analyzing multiple lower timeframes, and ultimately waiting for entry timing (=mBDSR signals) on the lower timeframe.Explanation usesover 780 charts in total.