
Today's Scenario USD/CHF
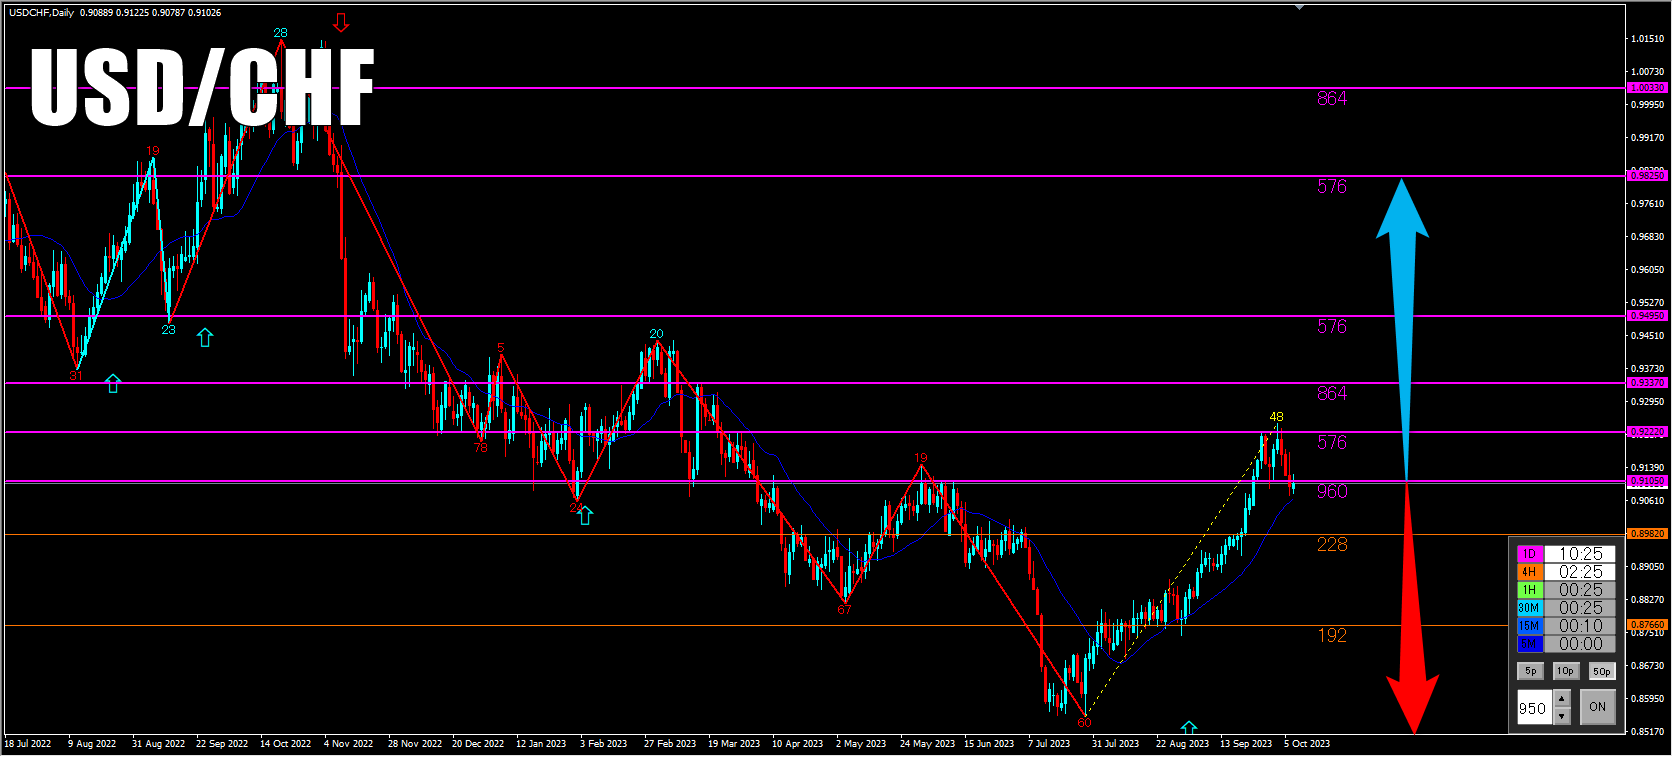
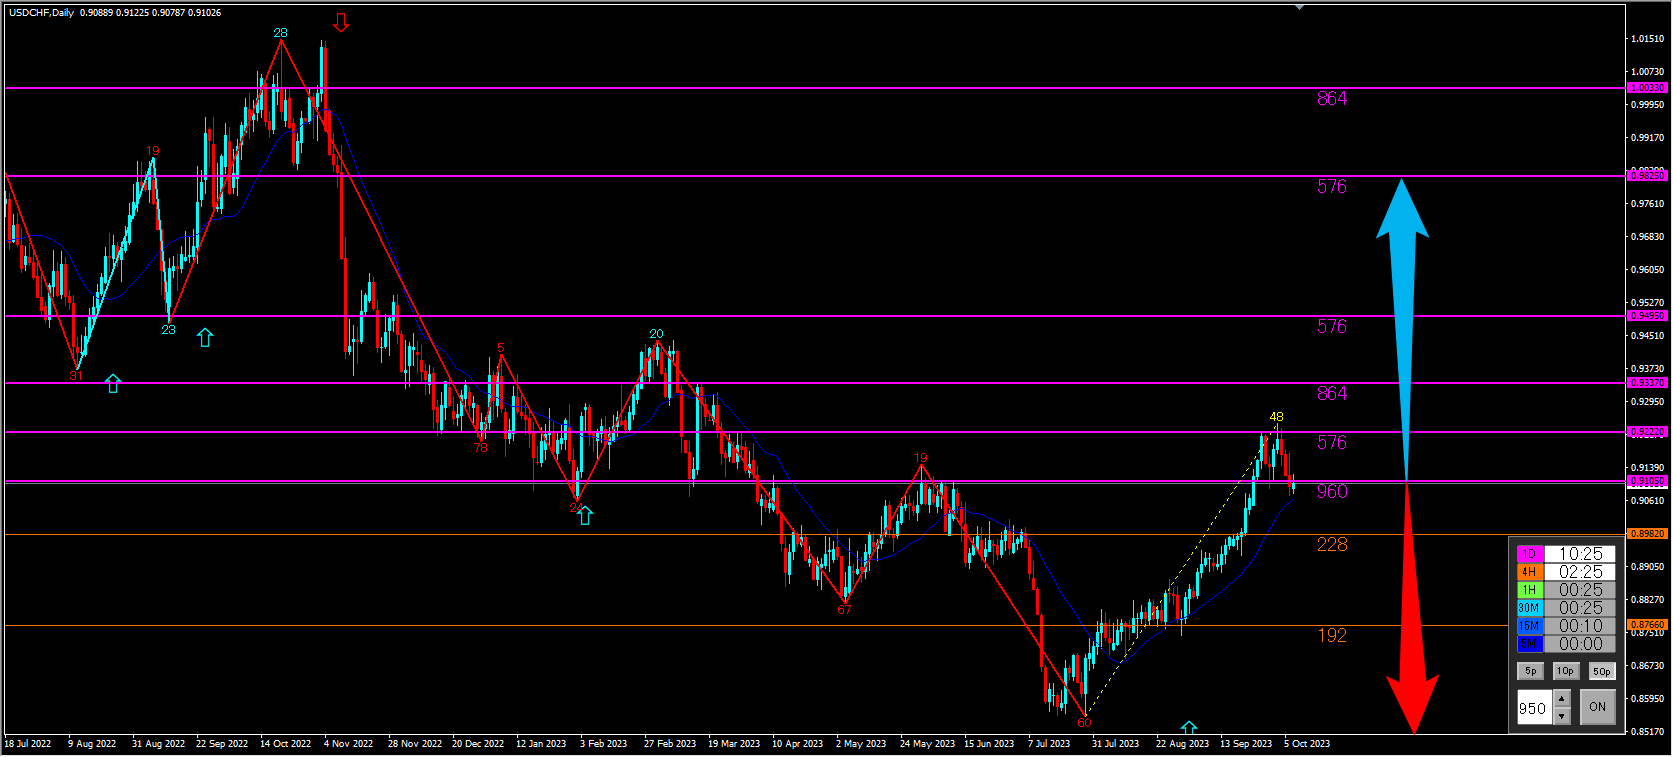
USD/CHF Daily Chart
In the daily chart, we are approaching the purple line (960) that is watched on the daily chart, and we will see whether it continues to rise or fall.
After a few weeks of an upward trend, will it become a range?
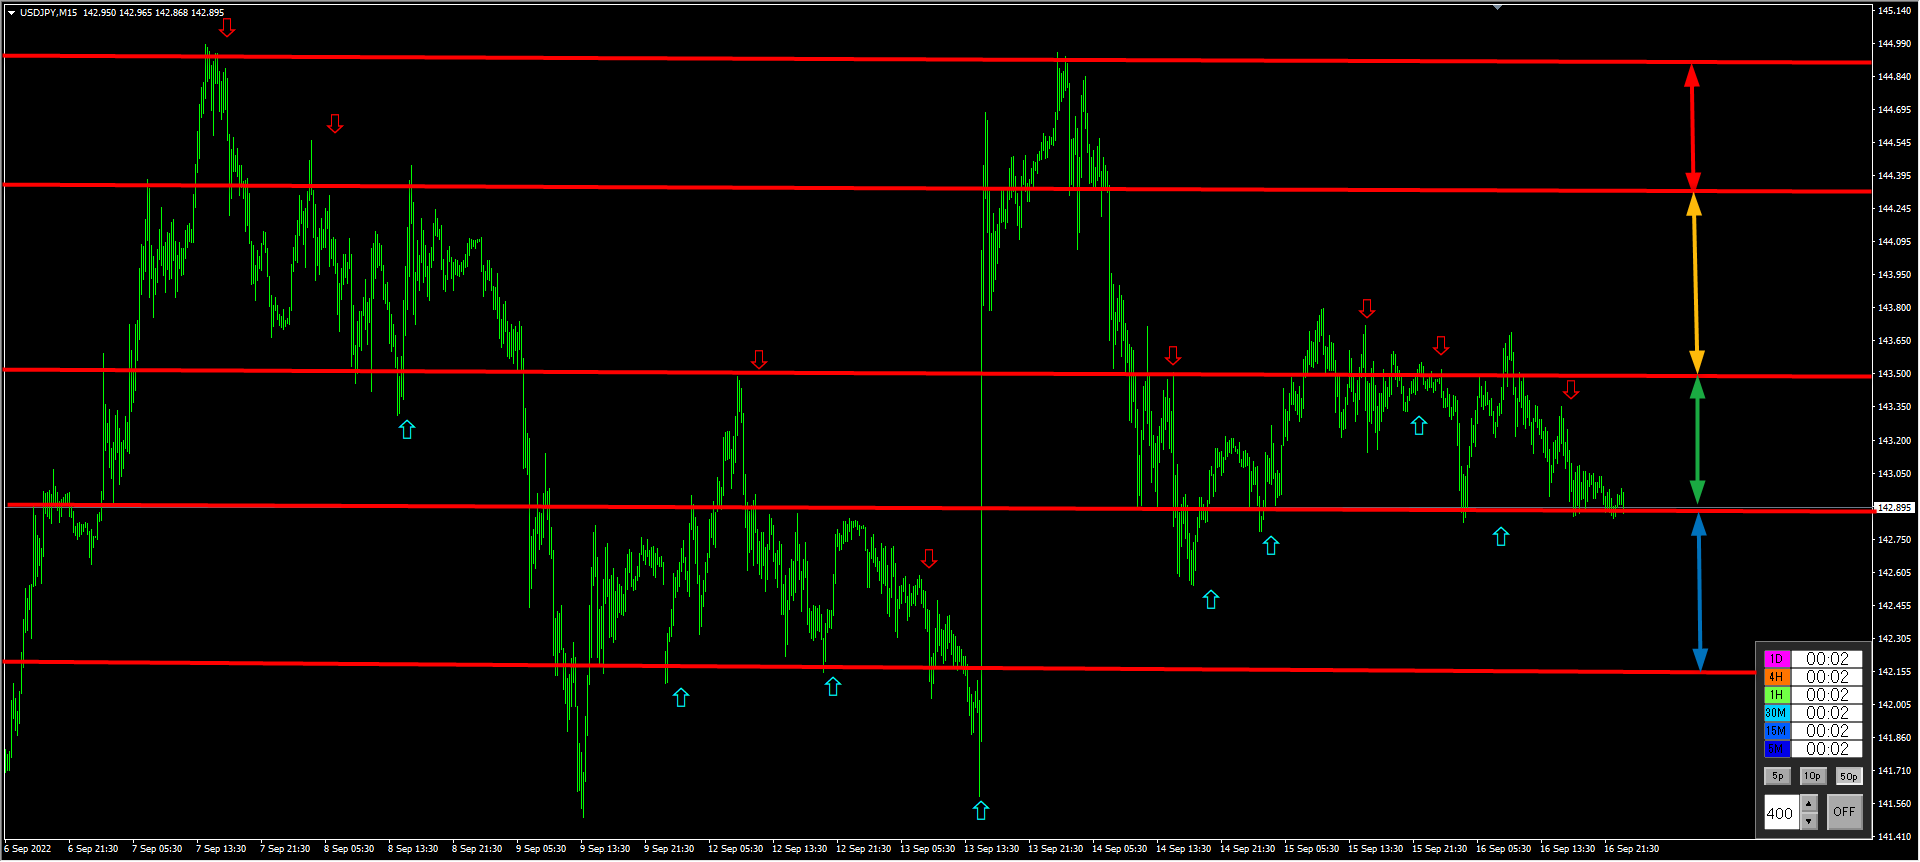
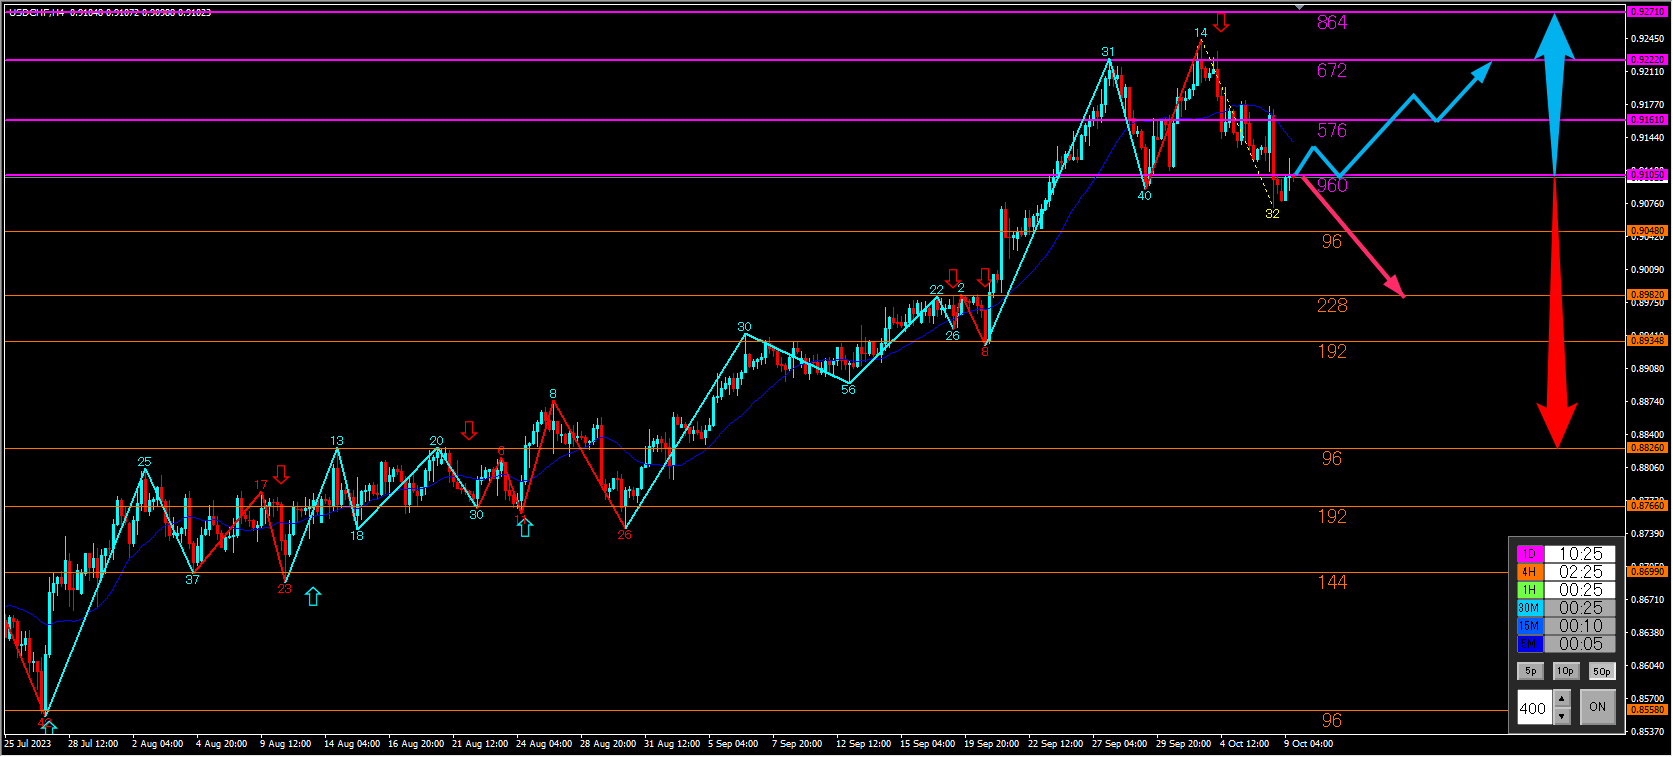
4-hour chart
A line of resistance is displayed at 400 PIPS intervals.
Once the downward trend begins, the resistant lines become fewer and movement may be large.
If it rises, there is a significant resistance line, suggesting a stepwise rise or a range-like movement may be expected.
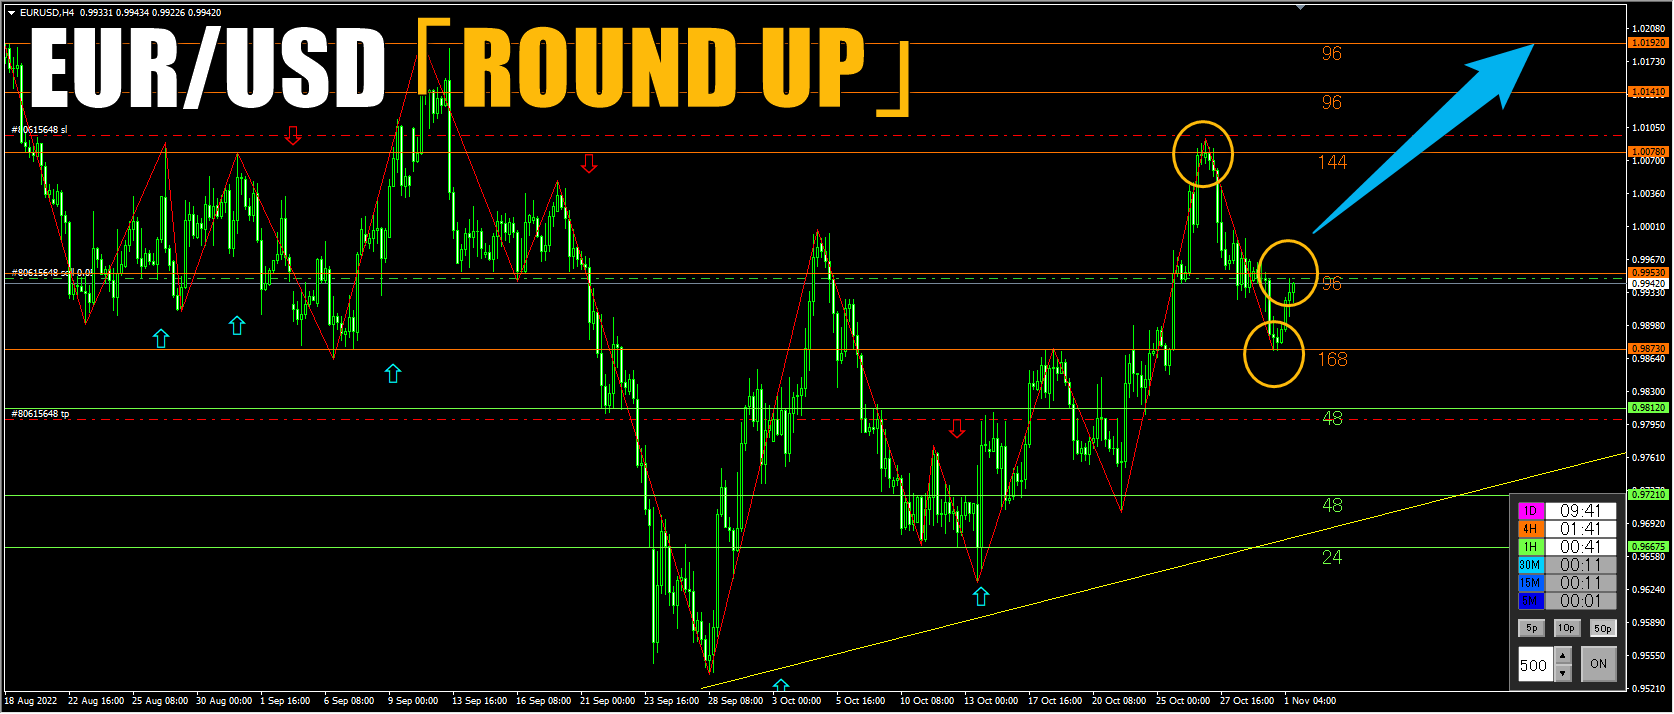
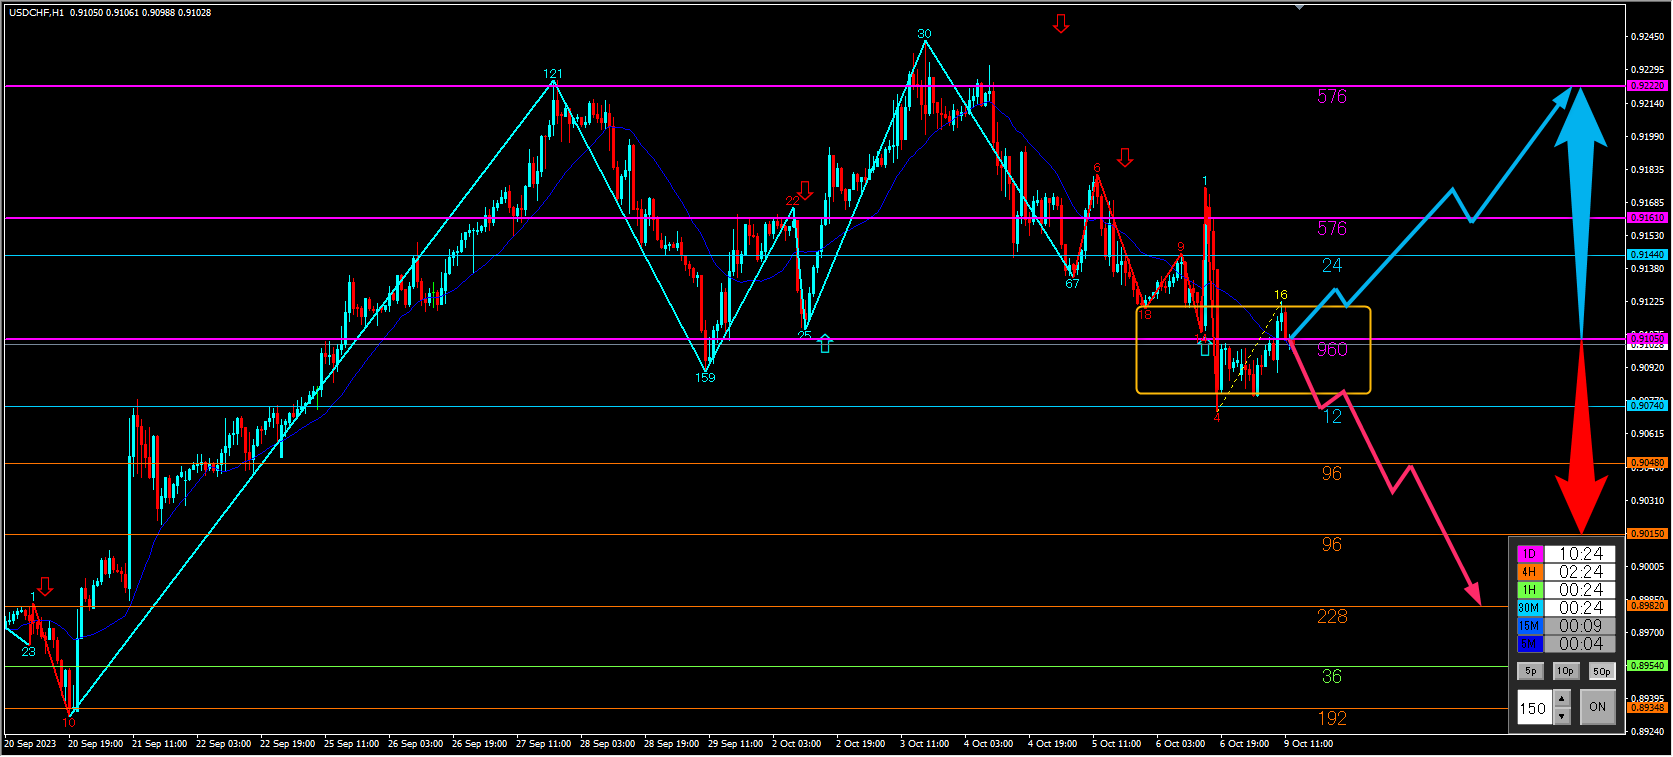
1-hour chart
The timing to break above or below the yellow box is considered the entry point.
If it declines, you can potentially capture a large move. If it rises, it may be prudent to lower the time frame and proceed cautiously.
× ![]()