
「ROUND UP」+「Line Scanner」10/18
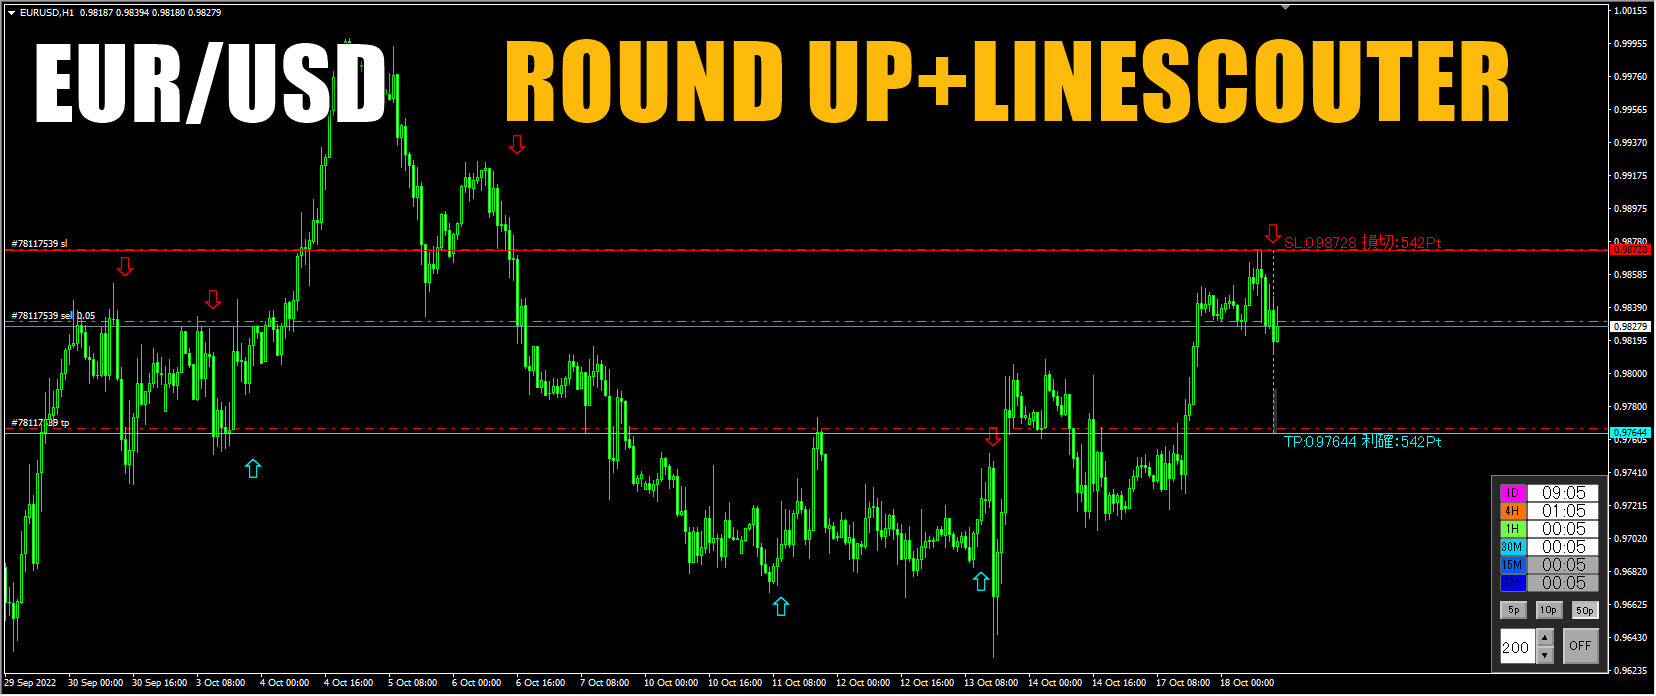
EUR/USD 1-hour chart
A sell signal at 21:00 appeared with the "ROUND UP" signal as shown below.
This time, because it pairs well with the Line Scanner to explain the basis for entry,
I will provide an explanation since it turned into a conveniently suitable chart.
The display showing only the "ROUND UP" signal is as shown below.

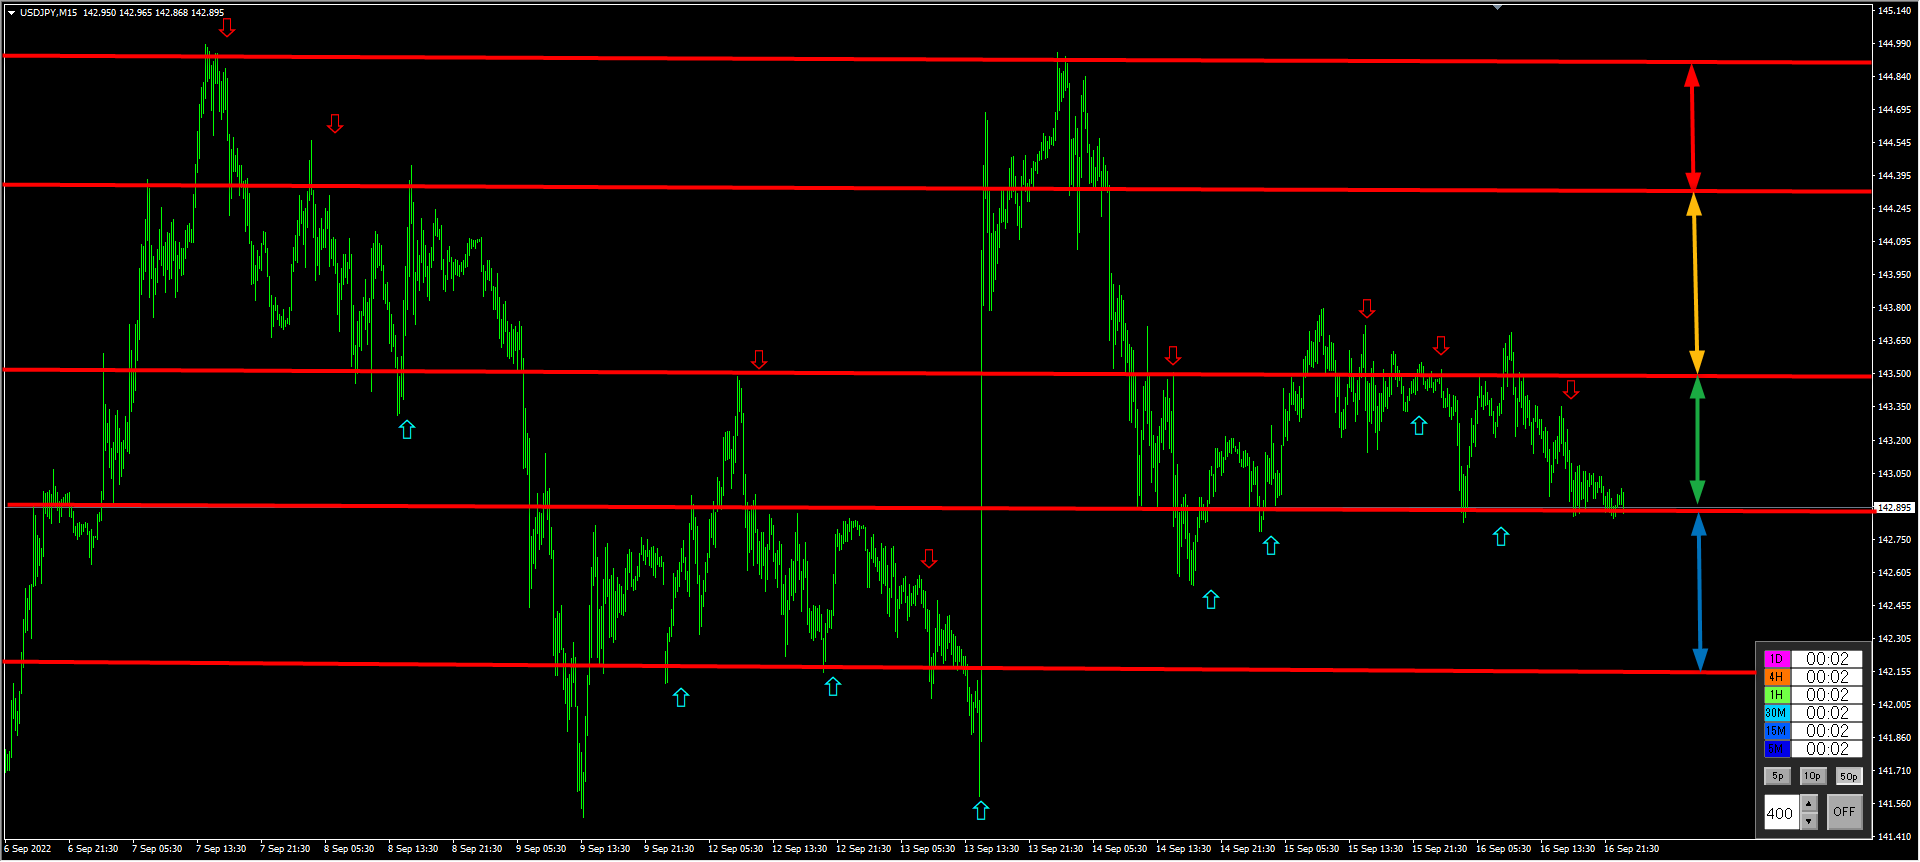
Here, the "Line Scanner" will be displayed.
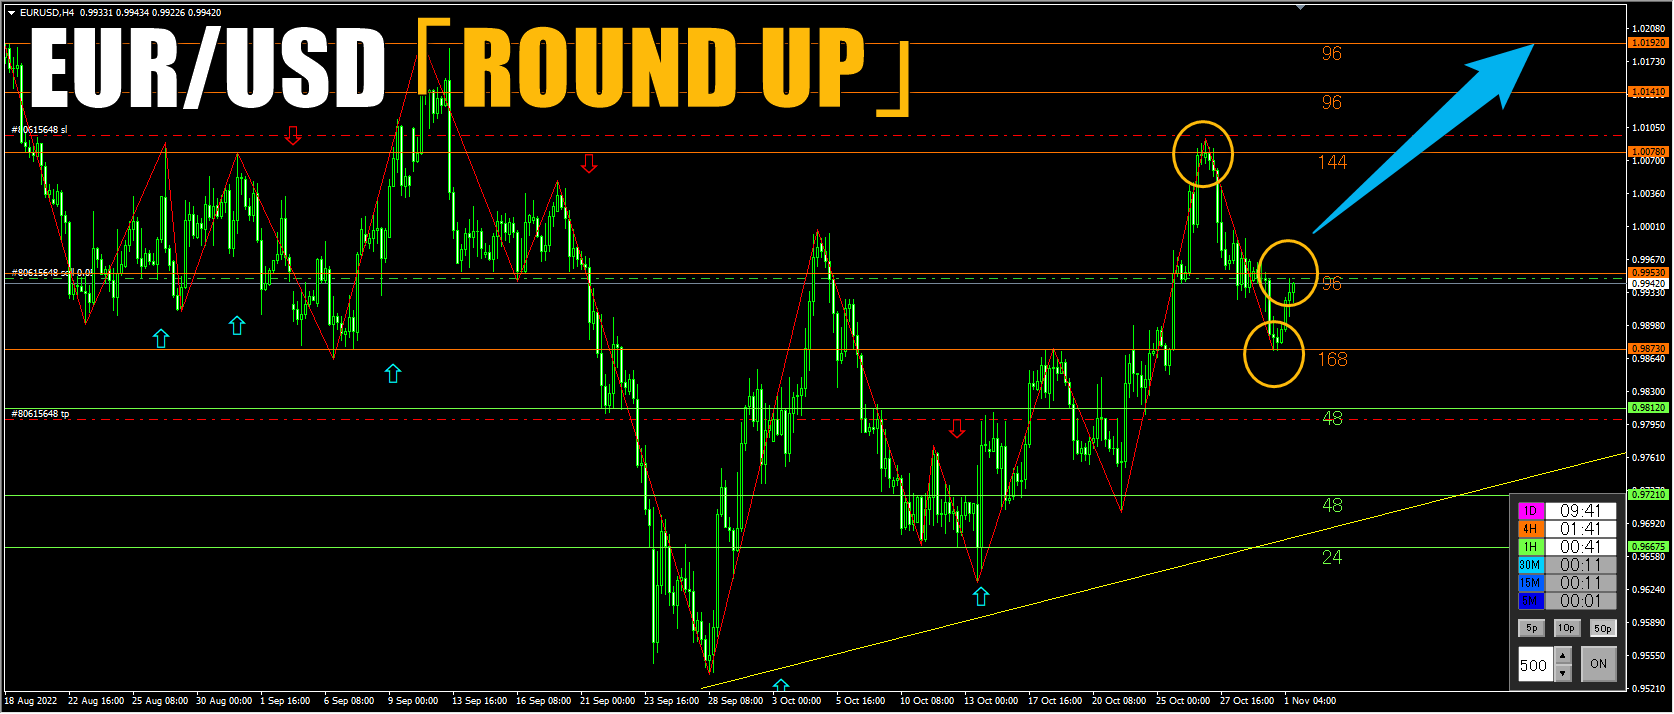
Near the ROUND UP stop loss (SL) line, there is an orange line (95).
This orange line (95) is a strongly acknowledged support/resistance line on the 4-hour chart, and the number beside the line indicates the line's strength and rigidity.
The current chart pattern also touches the orange line (95) with the candlestick wicks, showing a reversal from the upward momentum.
Taking a sell entry with the SL set behind this strong orange resistance line (95).
Since it’s a higher-timeframe support/resistance line, there can be false breakouts with wicks.
I think it’s better to set the SL with a little more buffer.
Then, the immediate green line (54) is a support/resistance line watched on the 1-hour chart. Recently it rose smoothly without resistance, but around the green circle it seems to react to the green line.
If you break through here, there is a basis to reach the take profit (TP) as per the signal.
Of course, nothing is absolutely guaranteed by future price movements, but by making trades with a basis built on analyzed support/resistance lines across the past charts and timeframes, you can improve your win rate.