
「ROUND UP」+「Line Scanner」9/7~9/16
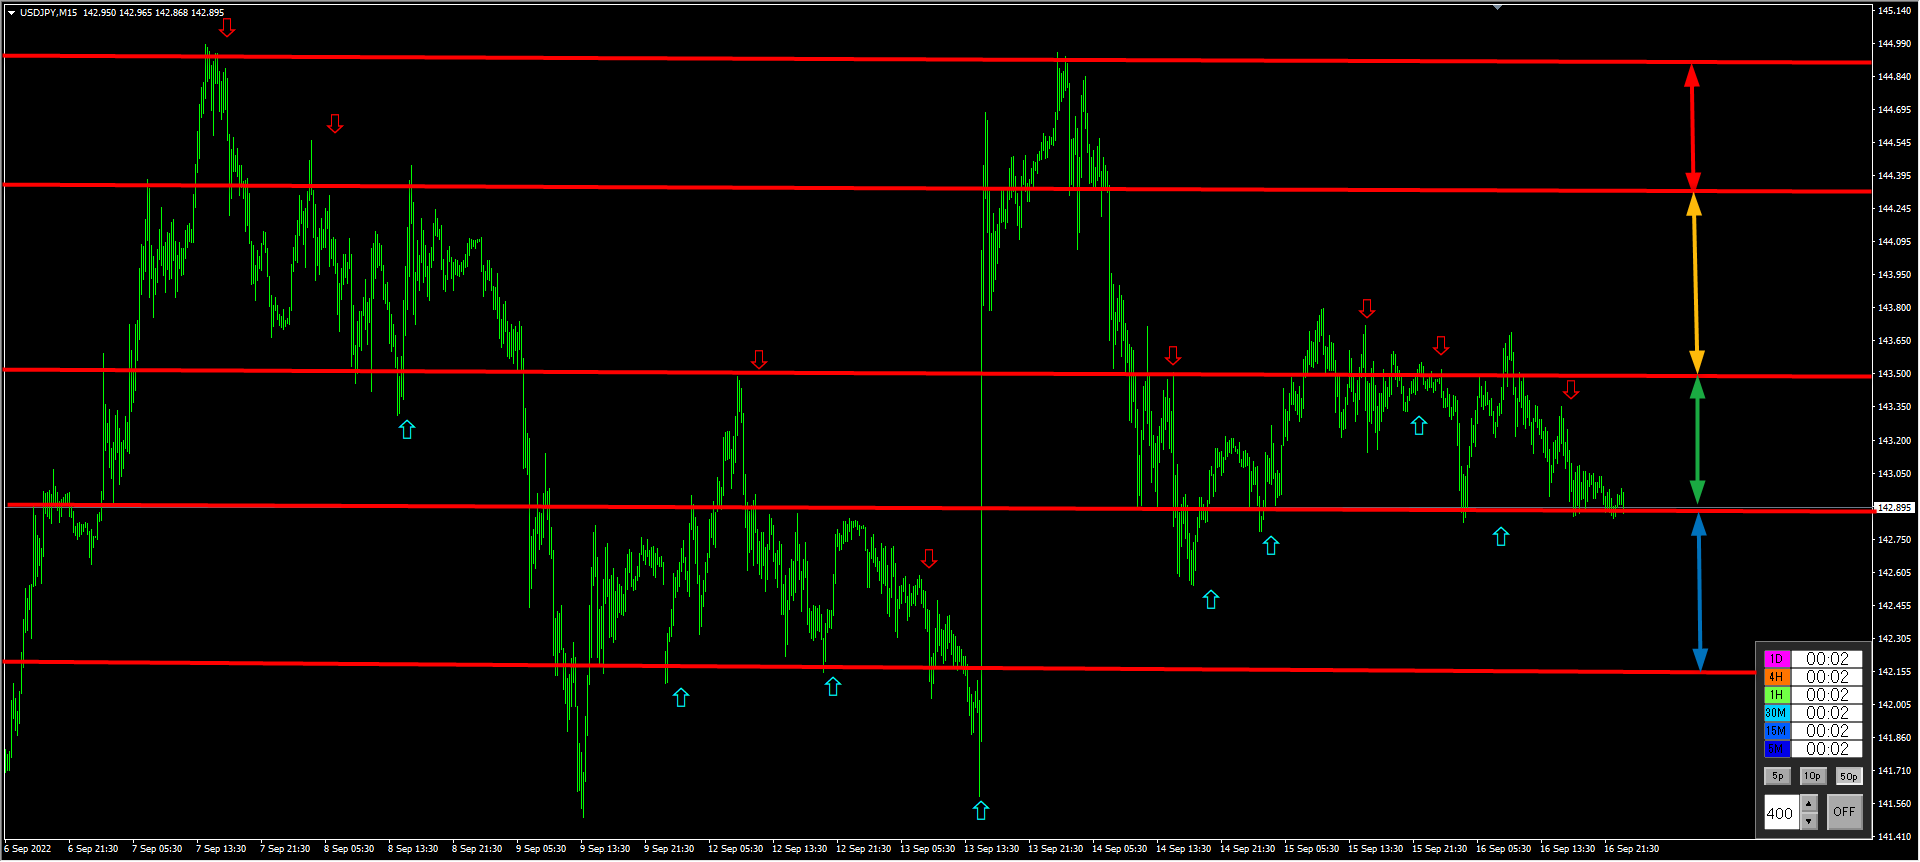
9/7 to 9/16, the 15-minute chart signal for USD/JPY's "ROUNDUP".
The current market is at multi-decade highs, with new weekly highs being set.
There is no comparable larger time frame, so 5 minutes to 1 hour is a reasonable range.

Here we draw the support and resistance lines.
In large terms, five lines can be drawn, and it appears the price is moving across four blocks of areas.

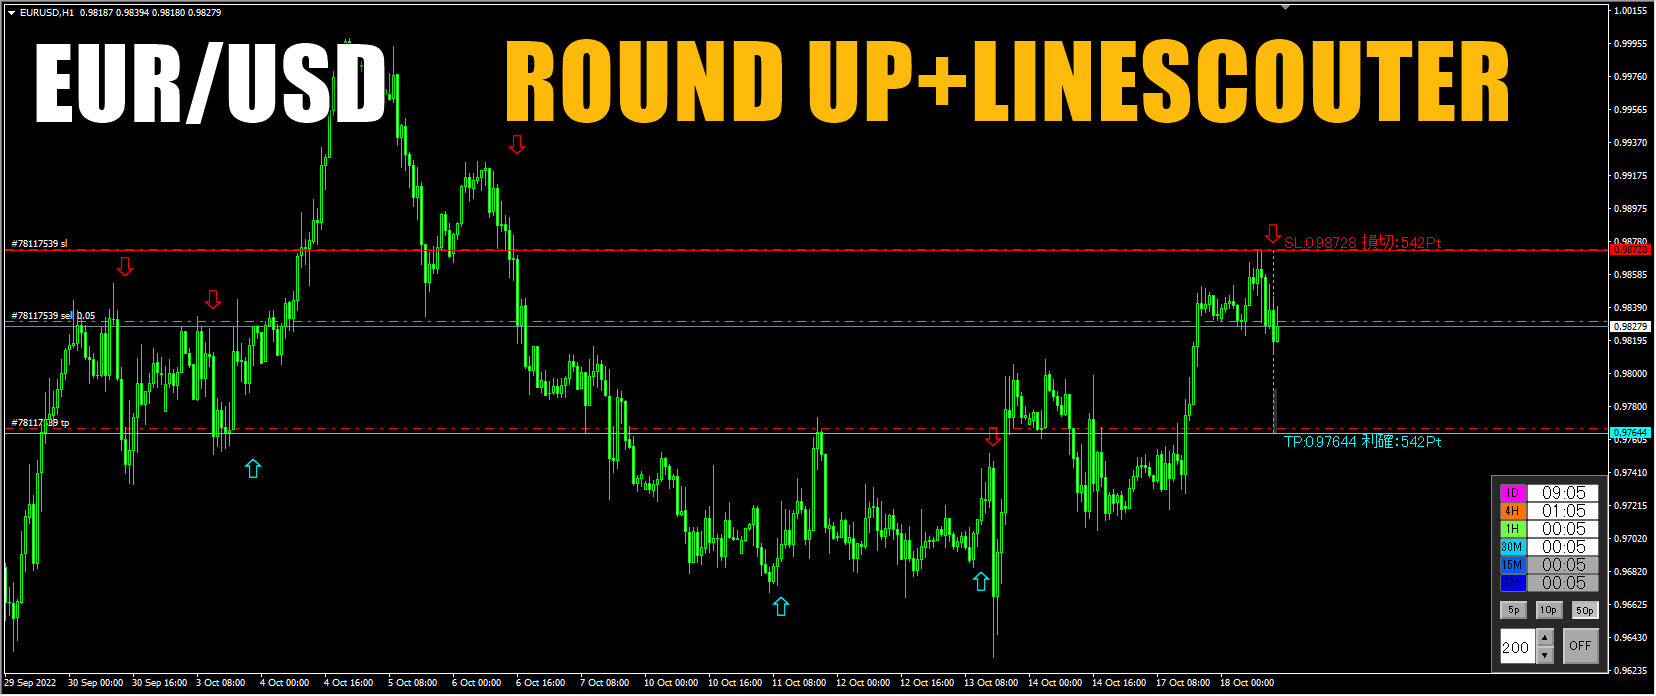
Viewed with the awareness of these support and resistance lines, the signals become a quite reasonable point.
Because "ROUND UP" is hard to understand in a still image, please check the video.
The automatic drawing of support and resistance, "Line Scouter," will also be displayed together.
The firmness and strength of the support/resistance lines are expressed numerically and by color, making it very convenient.
When a signal appears, be mindful of where the price gets stopped or bounced by the support/resistance lines.
If there is a hard support/resistance line between the entry point and the take-profit level, refrain from entering.
Conversely, if there is a hard support/resistance line just before the stop-loss point, it becomes a more reliable signal.
Also, during major price movements due to indicators or events, profits could be substantial, but it is safer to refrain from entering.
In addition to product descriptions, we plan to post the market scenario for the day.
Thank you for your continued support.
| |
| |
| |