

Fibonacci Expansion and Countertrend Line and Double Bottom and mBDSR Signal
An indicator that shines in combination with RCI【BODSOR・mBDSR】
https://www.gogojungle.co.jp/tools/indicators/11836

In recent Investing Navigation+ articles,the high harmony between various trading methods and mBDSR signalsis illustrated with examples.
Australian Dollar 1-hour chart

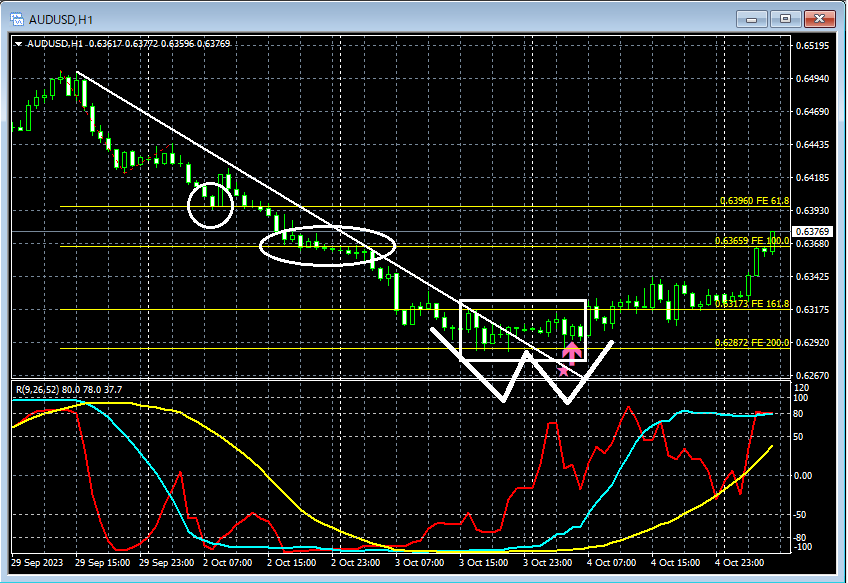
Fibonacci Expansionas the focus, the scene is...
Fibonacci ExpansionRebound at 61.8% → range around 100% → range between 161.8% and 200.0%, then rising.
Counter-trend Lineas the focus, the scene is...
Counter-trend Linefrom a breakout and pullbackmBDSR (RCI two-lines filter) selling pullback signallights up, then it rises.
As a result,a Double Bottomsignals on the right-side trough and then rises.
From this example,a trading method focusing on Fibonacci Expansion, Counter-trend Lines, and Double BottomandmBDSR signals
Also, in this example,placing a stop-loss slightly below the recent lowandachieving a high risk-reward tradeis possible.
An indicator that shines in combination with RCI【BODSOR・mBDSR】
https://www.gogojungle.co.jp/tools/indicators/11836
A PDF file with 170 items is included.Many of them areexamples that compile a process from logically linking multiple lower timeframes to higher timeframes using three RCI lines, ultimately waiting for pullback buying or pullback selling timing (= mBDSR signals) on the lower timeframe.The explanations usemore than 650 charts in total.
× ![]()


