

From today’s EUR/USD chart (October 4, 2023): pullback buy
Indicator that shines in combination with RCI [BODSOR・mBDSR]
https://www.gogojungle.co.jp/tools/indicators/11836

EURUSD 1-hour chart
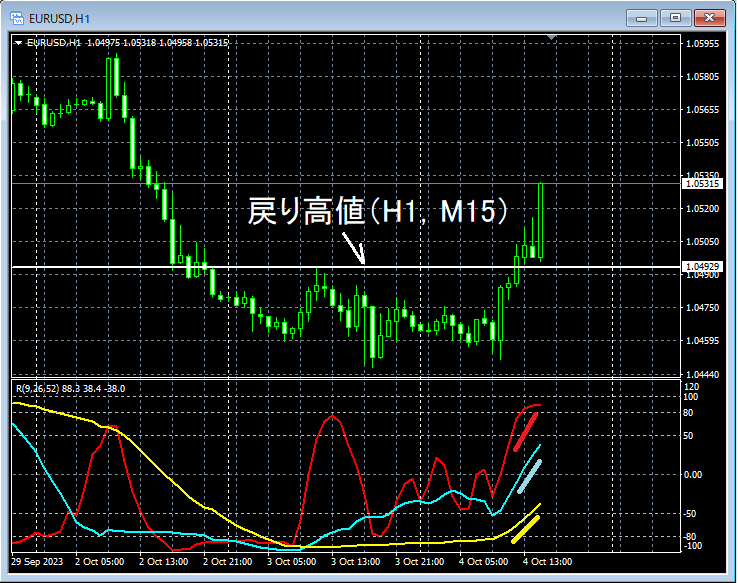
On the 1-hour chart, the price breaks above the retracement high. A strong bullish pattern with all three RCI lines rising.
EURUSD 15-minute chart
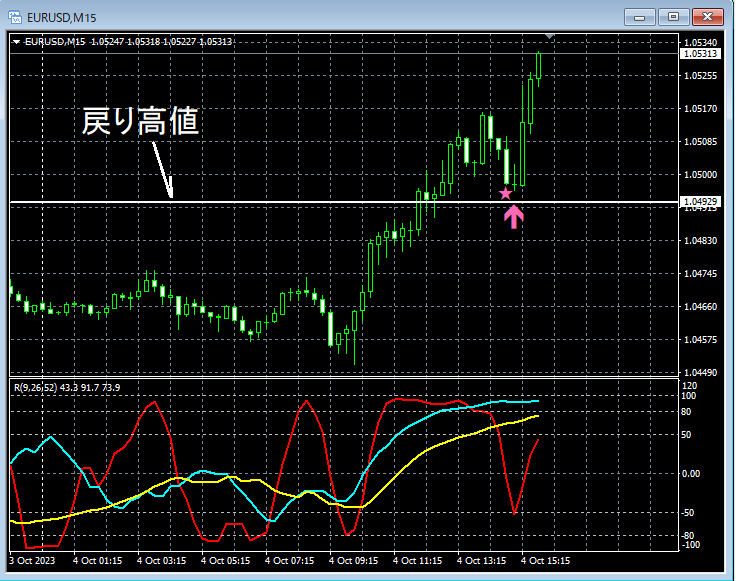
On the 15-minute chart, after breaking above the retracement high, the pullback signals a buying opportunity with mBDSR (two RCI lines filter), leading to an up move.
Indicator that shines in combination with RCI [BODSOR・mBDSR]
https://www.gogojungle.co.jp/tools/indicators/11836
A PDF file is attached with 170 items.Many of them areexamples that lay out how to logically link higher and lower timeframes using the three RCI lines, sequentially considering the state of multiple lower timeframes, and ultimately waiting for a pullback buying or pullback selling timing (i.e., mBDSR signals) on the lower timeframesand are compiled in this way. The explanations useover 650 charts in total.are used.
× ![]()


