

Sign and indicators release after the plunge and subsequent selling pressure and Fibonacci retracement
Indicator that shines in combination with RCI【BODSOR・mBDSR】
https://www.gogojungle.co.jp/tools/indicators/11836
An indicator developed to improve entry accuracy when using three-line RCI for buying on dips and selling on rallies.
It comes with 150 PDF files.Many of them describe examples that incorporate logically linking the higher and lower timeframes with the three-line RCI to sequentially analyze multiple lower-timeframe conditions, ultimately waiting for a dip-buy or pullback-sell timing on the lower timeframe (i.e., the mBDSR signal).The explanations usemore than 550 charts..
Taking last week’s (September 20, 2023) pound-dollar as an example,I would like to write a little about pullback selling after a sharp drop following a data release.
I think it is very important for effectively utilizing the combination of RCI three lines and mBDSR.
Pound-Dollar 30-minute chart
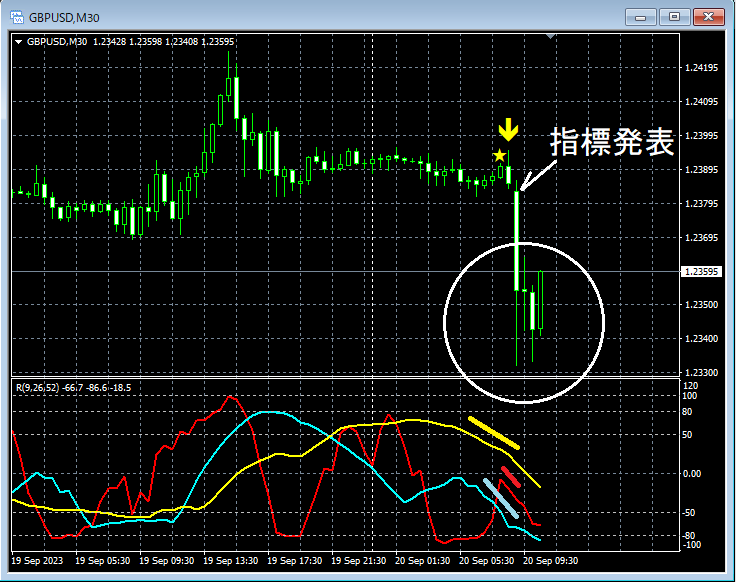
Main window: mBDSR signals (RCI two-line filter)
Sub window: RCI three lines
In the 30-minute chart, after the pullback sell signal of mBDSR lights up, there is a sharp drop following the news release.
RCI three linesline up into a very weak downward form, and around the circled area it might be reasonable to look for pullback selling on the lower timeframe. Let’s examine this behavior in more detail on the 5-minute chart.
Pound-Dollar 5-minute chart
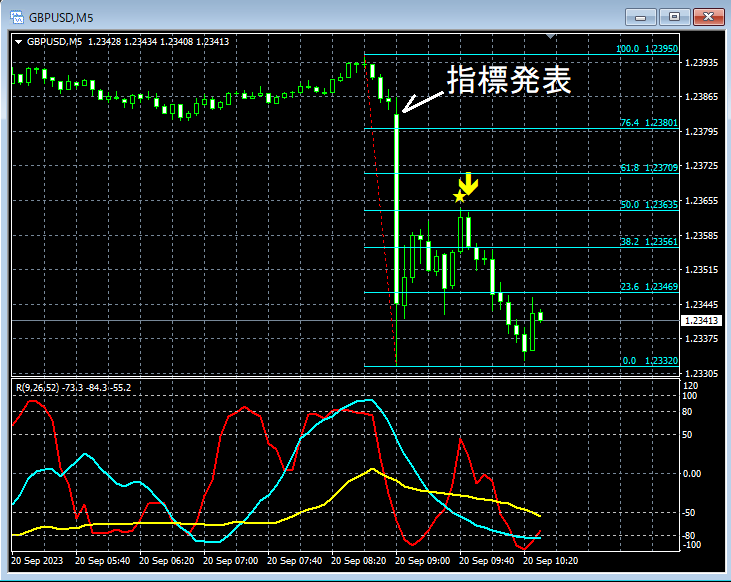
Main window: mBDSR signals (RCI two-line filter)
Fibonacci Retracement
Sub window: RCI three lines
On the 5-minute chart, there is a brief rebound.50.0% retracement according to Fibonacci Retracementaround this areamBDSR signallights up, indicating another downward move.
In the above example, the timing of the pullback sell after the indicator release is helped bythe mBDSR signal.
Also, looking from another perspective...
mBDSRis, for example, used in approaches such as
● Measured depth of pullbacks and ralliesFibonacci retracementis emphasized as an important method
and can be viewed as one of the factors for entry decisions.
From this example,a trading method focused on Fibonacci retracementanda method using RCI three linesandmBDSR signalsshow strong compatibility.
※Please note that for the charts shown in this article, for ease of explanation, circles, straight lines, and rectangles may have been added.
It comes with 150 PDF files.Many of them describe examples that incorporate logically linking the higher and lower timeframes with the three-line RCI to sequentially analyze multiple lower-timeframe conditions, ultimately waiting for a dip-buy or pullback-sell timing on the lower timeframe (=the mBDSR signal).The explanations usemore than 550 charts.

× ![]()


